In this blog post, I’ll cover some of the basics of CPU Sampling, the method the Visual Studio profiler uses to capture CPU performance data in your applications. If you’re interested in performance profiling, we welcome any feedback you have and encourage you to help us build better performance tooling!
What is sampling?
In a software performance analysis, the very first question to ask is “why is my code taking so much time?” Ideally we would show you the timeline of all of your functions and when they ran. While it’s possible to get this information, it can significantly slow down the execution of your program because it requires us to record information on every function call. CPU sampling takes a snapshot of what is running at a set interval without noticeably slowing down your program. The aggregation of these snapshots gives us an estimate of how long the functions in your program are taking to execute.
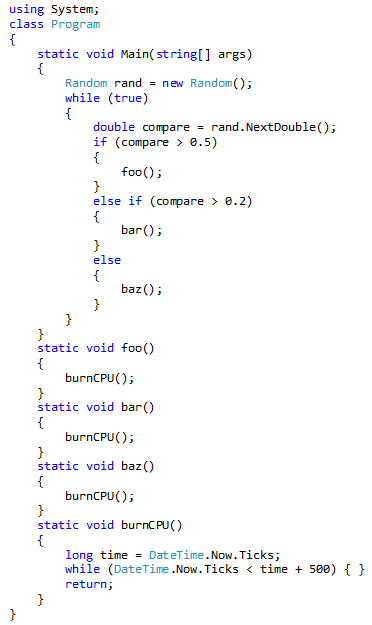
To understand how sampling works, let’s walk through an example using the following program:
We have 3 functions, foo(), bar(), and baz(). All three functions perform the same task: continuously watch the time until 500 ticks have passed. 50% of the code’s runtime should be spent in foo(), 30% in bar(), and 20% in baz().
We’ll begin by manually sampling the execution of the program using the debugger. To do this, start the program with the debugger, and after some interval of time, hit the Break All button in the debugger toolbar:
This will pause execution of the program so you take a look at the current call stack:
Congrats! We’ve captured our first sample. This call stack tells us what function was doing at the current point in time, as well as the execution path the program took to reach that location. In the screenshot above, burnCPU()was the currently running function, and it was called by baz(), which was called by Main(). Let’s write down this information:
We’ve now taken a measurement about what was running at one specific point in time. Let’s do it again: hit Continue in the debugger toolbar, and after some more time, hit Break All. This time, I got the following stack (yours will vary due depending on when exactly you hit the Break All button):
Let’s update our table with this new information. We’ve seen Main() before, so let’s increment the total times we’ve seen it. We’ve seen burnCPU() before when it was called by foo() – but not when it was called by baz() – so this time, we need to add another couple of rows to keep track of this call path. By doing so, we’re constructing a Call Tree:
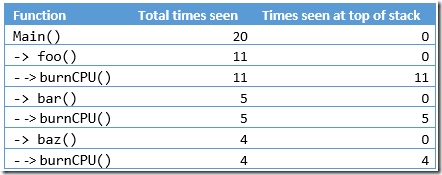
Let’s continue this process and took 20 different snapshots of the Call Stack. I arrived at the following Call Tree (yours might differ a little bit):
We just manually profiled our application with sampling. Let’s discuss a couple observations in this table. First of all, we kept track of how many times burnCPU() was seen at the top of the stack. The profiling term for this is Self Time (or “Exclusive” in some profilers): it indicates how much time a function, but not functions it called, was running. The amount of time a function, including function calls that function made, is represented by Total Time (or “Inclusive” in some profilers).
Now take a look at the breakdown of samples between foo(), bar(), and baz(). 55% of collected samples had foo() on the stack, with 25% and 20% in bar() and baz() respectively. This is a close to the 50/30/20 split we had expected when we wrote the program, but not quite.
Why wasn’t the split more accurate?
We measured the characteristics of a subset, the call stacks as we hit break all, to measure the characteristics of a population, the actual runtimes of the functions of the application. foo() and baz() were 5% away from their ‘true’ time. The big reason on why we see these differences is that we didn’t get enough samples to reflect the truth more accurately.
That’s where profiling tools come in.
Profiling tools repeat the process we just did manually hundreds or thousands of times a second. These tools ‘snapshot’ the call stack at a specified interval, and compute the total time and self time for us. Profiling tools will also aggregate the samples and build the call tree, so there’s no need to manually write anything down.
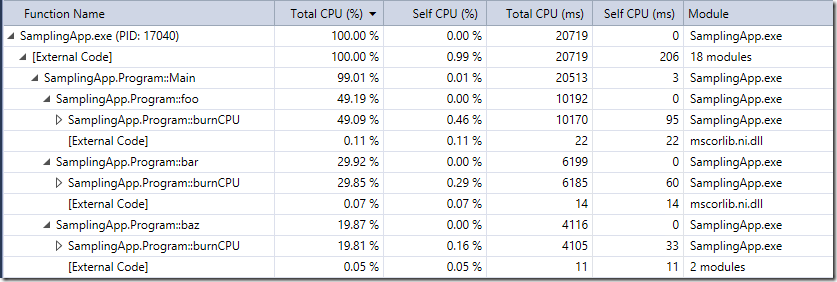
I sampled this program using the CPU Usage Tool for roughly 20 seconds, and got the following results:
The Visual Studio CPU Usage Tool captures samples at a rate of 1000 samples / second (or once a millisecond). In 20 seconds of analysis, we see the breakdown between foo(), bar(), and baz() to be almost exactly 50/30/20!
So how many samples do I need?
The number of samples you need depends on how accurately you want to measure your program’s performance. In general, the more samples, the better. In order to collect more samples, you can either sample your application for longer or increase the rate at which you sample (more information on the effects of sampling on your application below).
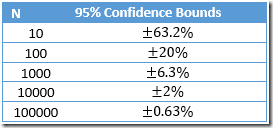
The error in the number of samples collected scales by the square root of the samples collected in a given function. Using this rule, the following table represents the 95% confidence interval for N samples collected:
If we see 10 samples in a function, the true amount of time spent in that function is somewhere between 3.68 and 16.32 (10 ± 63.2%) with 95% certainty. As we see the number of samples scale upward, the error in sampling is much less of a factor.
Two rules of thumb when collecting samples (credit for these go to PerfView):
- The greater number of total samples you collect, the more accurate your profile will be. 1000+ total samples is a good starting point, and 5000+ samples is ideal.
- The more samples seen in a particular function, more accurate your timing of the function is. If a function had only 1 or 2 samples seen in it, it’s possible that the function was a fleeting event that was seen due to the randomness of sampling. If a function has several hundred samples captured in it, it may be a worthy target of optimization efforts.
How does sampling effect my program?
Turning sampling on requires your CPU to perform additional operations. Therefore, sampling does have overhead on your application and could cause it to slow down.
In the Visual Studio CPU Tool, we use Event Tracing for Windows (ETW) to collect call stacks and a variety of other information. In general, we see about a ~5% slowdown of your application while capturing ETW data for your application. This slowdown is seen as we capture samples at a rate of 1000 samples / second, a rate we believe is good for analyzing most applications. Increasing the sampling rate will consequently slow down your application even further.
Finer Points about Sampling
It’s important to note that in this example all of the functions are CPU-bound – they spent all of their respective time eating cycles on the CPU. There’s several cases in which your applications may not be CPU-bound. For example, if your code is waiting on I/O or blocked on a Http or database request, the CPU Usage Tool will not increment the number of samples in the respective function. This highlights the difference between CPU Time and Wall Clock Time: CPU Time represents the amount of time your function was running on the CPU, whereas Wall Clock Time represents the total amount of real-world time a function took to run. When a function is CPU-bound on a particular thread, Wall Clock and CPU Time will be the same. If a function is blocked on a non-CPU operation, then Time Blocked + CPU Time = Wall Clock Time. If a function is multithreaded, it’s possible for CPU Time to actually exceed wall clock time (we increment a function’s sample count twice if that function is seen on two different threads in one sample).
Conclusions
I encourage you to try sampling in your applications, no matter how simple or complicated your codebase is. Almost all code written can be more performant and sampling is a quick way to identify the code taking the most time. With Visual Studio 2015, sampling becomes very easy via the CPU Usage tool: you can start sampling in a click of a button and fix performance problems all without leaving the debugger.
I’m always interested to hear your experiences with sampling or other performance analysis – feel free to reach out to me via Twitter or sign up to give feedback as part of our performance community!


0 comments