Chris Kinsman wrote a great article on where to use PreEmptive Analytics for Team Foundation Server with best practices, implementation considerations etc etc for MSDN Magazine.
The best part i found of this article was the tutorial on getting started. In talking to Chris i mentioned i would love to have a quick and dirty “primer” on the ALM Blog.
Hope you enjoy it!
(Thanks Chris!)
*************************
An important new tool inside Visual Studio and TFS 2012 allows you to capture all the information about issues in your applications across clients and services—and quickly respond to them by having all the information accessible to the team. Called PreEmptive Analytics for Team Foundation Server (PA for TFS), this integrated component in TFS 2012 helps teams identify the most important and widespread issues in deployed applications before users even report them. While there are several ways to get PreEmptive Analytics setup one of the easiest ways to get PA for TFS running would be.
Step 1. Install PA for TFS
The first step is to install PA for TFS. A SQL Server instance is required to store the data. To test this inside a firewall, install the Combined Exception Endpoint and Exception Aggregator role. Point it at the TFS server and specify a TFS account that can create and edit work items. This will install the Exception Endpoint and Exception Aggregator services and create a database to persist the exception data. When the installer is done, it will give you the URL for the Exception Endpoint service. Save this for use later, when configuring your application instrumentation.
Step 2. Install Team Explorer Extensions
The installer automatically launches the PreEmptive Analytics administration console. Use this console to configure the connection to the TFS server and provision Team Projects with the PA for TFS extensions. This will add the PreEmptive Analytics node under the Team Project in Team Explorer.
Step 3 Instrument Your Application
Add, five attributes: ApplicationAttribute, BusinessAttribute, ExceptionTrackAttribute, SetupAttribute and TearDownAttribute to your application. The ApplicationAttribute, shown in Figure 1, is placed at the assembly level and identifies the specific application you’ll be tracking. It’s keyed with a GUID and includes the Name and Version. Using the GUID Generator that comes with Visual Studio, generate a GUID in Registry Format and then strip off the curly braces after pasting it into the attribute. Keep record of this GUID, as it will be needed it later when configuring the aggregator.
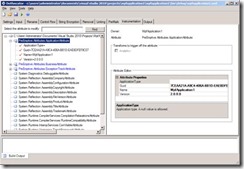
Figure 1 The ApplicationAttribute Identifies the Application Being Tracked
The BusinessAttribute, shown in Figure 2, is also placed at the assembly level and keys the application to the company. Generate the GUID again using the GUID Generator and make sure to note it for later use when configuring the aggregator.
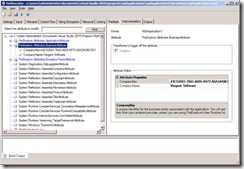
Figure 2 The BusinessAttribute Identifies the Company
**
The SetupAttribute, shown in Figure 3, is placed on the application entry point and sets up the collection and reporting of data by PA for TFS. It specifies the Exception Endpoint that should be contacted to report the data. Fill in the value from the end of the Exception Aggregator setup. It will likely also be necessary to scroll down to the bottom of the Attribute Properties grid and set UseSSL to False if a certificate isn’t installed. It’s also possible to drill into the App class and place the SetupAttribute into Main, as shown in Figure 3.
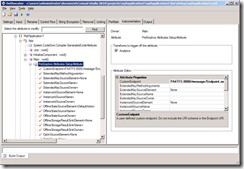
Figure 3 Placing the SetupAttribute into Main
The TeardownAttribute, shown in Figure 4, is placed on the application exit point and wraps up the collection of data, flushes buffers and ensures that PA for TFS has shut down cleanly as the application exits. As with the SetupAttribute, it’s possible to place the TeardownAttribute into the Main method, and Figure 4 illustrates this.
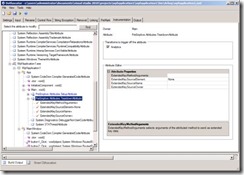
Figure 4 Placing the TeardownAttribute into Main
The final attribute, ExceptionTrackAttribute, shown in Figure 12, can be placed anywhere to track exceptions in the application. In this case, to handle all uncaught exceptions, the attribute is placed at the assembly level and configured to report all unhandled exceptions. To collect comments and contact information from the end user, you can optionally set ReportInfoSourceElement to DefaultAction. This will provide a default UI to collect this data.
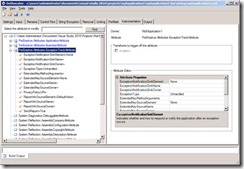
Figure 4 Placing the ExceptionTrackAttribute into the Application
Step 4 Build a new version of the executable. Once all the attributes have been applied, Dotfuscator is used to build a new version of the executable. This build process can be automated and done as part of a TFS build once you’ve done the initial configuration.
Step 5 Configure the Aggregator. Start the Aggregator Administrator Console and add the TFS Instance and Team Project collection. Select the Team Project being used and click the Apply action next to it in the grid. Figure 5 illustrates application of the Team Project extensions to a project called Agile.
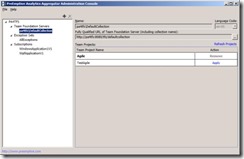
Figure 5 Placing Team Project Attributes into the Project
The default Exception Sets are fine to start with, so we’ll move on to the Subscriptions. Add a subscription for the application and give it a name. This example is simply called WpfApplicationV1. Fill in the Company ID and Application ID GUIDs noted when instrumenting the application. Bind it to the TFS and Team Project added previously. Optionally select an area path from the Team Project. The default rule should be fine—just be sure to change the threshold from 80 to a value appropriate for your needs. Close the console and select Save when prompted.
Step 6 Deploy Your Application You’re done, and the team can now deploy the application. Make sure to grab the instrumented version that Dotfuscator created in the Dotfuscator directory when it’s deployed.
**Summary: **
Now that the application is running out in the wild you can now simply create a query new for Incident type work items and let your mind rest a little easier knowing you are now watching your production applications day and night! PreEmptive Analytics makes TFS even more compelling by making production issues immediately actionable as work items shorten the mean-time-to-repair. See this link for Chris’s full article at MSDN on PreEmptive Analytics.
Of course make sure and check out the great MSDN documentation:

0 comments