At last! Everyone’s been asking for this, so we’re very pleased to announce it.
You can set up a continuous export of your telemetry from the Application Insights portal in JSON format. We put the data into blob storage in your Microsoft Azure account. From there, you can pick it up and write whatever code you need to process it.
For most recent updates about Continuous export go to our documentation page.
Set up continuous export
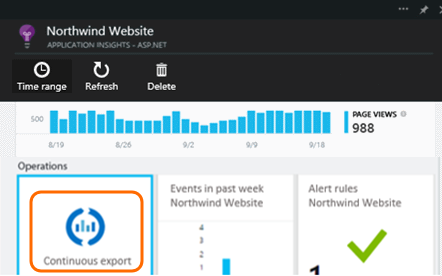
Open Continuous export from your Application Insights overview blade:

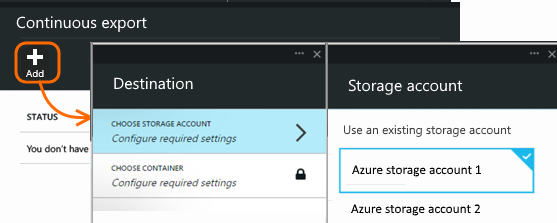
Add a new continuous export. Choose an Azure Storage account and the destination container where you want to put the data:

Once you’ve created your export, it starts going. There’s already telemetry hosing into there. (If you aren’t seeing any data, that’s probably because Application Insights isn’t seeing any coming from your app. You only get data that arrives after you switch on export.)
You can delete the export to stop the stream. Doing so doesn’t delete your data.
Get your telemetry
When you open your blob store with a tool such as CloudXplorer, you’ll see a container with a set of blob files. The URI of each file is application-id/telemetry-type/date/time.

The date and time are the time the telemetry was deposited in the store – not the time it was generated. This means that you can move linearly through the stored data.
If you want to download this data to your own machines, you could use the blob store REST API.
Or you could use Data Factory, in which you can set up pipelines to manage data at scale.
Analyze your stuff
OK, so now you’ve got your data – what’s in there?
What do you get?
The exported data is the raw telemetry we receive from your application, except:
- Web test results aren’t currently included.
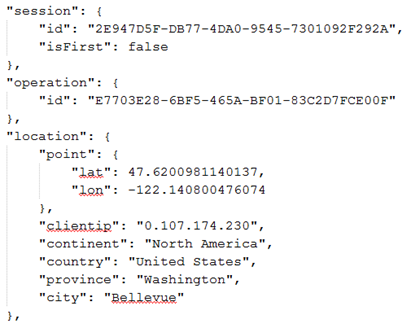
- We add location data which we calculate from the client IP address.
Calculated metrics are not included. For example, we don’t export average CPU utilisation, but we do export the raw telemetry from which the average is computed.
What does it look like?
Unformatted JSON. If you want to sit and stare at it, we like Notepad++ with the JSON plug-in, so that you can view it in a nicer layout like this:

How to process it?
On a small scale, you can write some code to pull apart your data, suck it into a spreadsheet, and so on.
If there’s going to be a lot of it, consider HDInsight – Hadoop clusters in the cloud. HDInsight provides a variety of technologies for managing and analyzing big data.
Delete your old data
Please note that you are responsible for managing your storage capacity and deleting the old data if necessary.
Recent updates
- You can now choose which telemetry types to export.
- Support edit export configuration.
What do you think?
We’d love to get your feedback. How can we make this better? How would you like to get your telemetry? Please let us know!
Q & A
-
But all I want is a one-time download of a chart while I’m looking at it.
We’re working on that one separately.
-
Why didn’t you create a REST API to interrogate data in the portal?
Well, you can programmatically get the data from the blob. We figure this solution is very flexible.
-
Can I export straight to my on-premises store?
No, sorry. Our export engine needs to rely on a big open throat to push the data into.
-
Can I export to an Azure SQL database?
No. It’s on the backlog.
-
Is there any limit to the amount of data you put in my blob?
No. We’ll keep pushing data in until you delete your export. We’ll stop if we hit the outer limits for blob storage, but that’s pretty huge. It’s up to you to control how much storage you use.

0 comments