(Posting for a team mate: Shiv Prashant Sood)
Battery draining applications result in bad customer experience and poor ratings. Optimal battery usage is an important aspect that a developer must consider. This post introduces the Energy Consumption tool, a new tool in the Visual Studio Performance and Diagnostics hub that enables you to optimize your application for energy consumption.
Motivation and Background
Low powered tablet devices are an integral part of our lives. We start and end our day with these devices using them for work, catching up with friends, reading, watching movies and lot more of our daily tasks. On such devices, battery draining applications lead to poor user experience and negative user reviews. It is therefore important that developers be able to estimate, and optimize, the energy impact of their applications.
Application energy consumption is dependent on a wide variety of system resources and conditions. Energy consumption depends on, but is not limited to, the processor the device uses, memory architecture, the storage technologies used, the display technology used, the size of the display, the network interface that you are connected to, active sensors, and various conditions like the signal strength used for data transfer, user settings like screen brightness levels, and many more user and system settings.
For precise energy consumption measurements one needs specialized hardware. While they provide the best method to accurately measure energy consumption on a particular device, such a methodology is not scalable in practice, especially if such measurements have to be made on multiple devices. Even then, the measurements by themselves will not provide much insight into how your application contributed to the battery drain, making it hard to focus on any application optimization efforts.
The Energy Consumption tool being introduced in Visual Studio 2013 for Windows 8.1 store apps, enables you to estimate your application’s energy consumption without the need for any specialized hardware. The tool provides power estimates that prioritize information that is in control of a developer, rather than trying to accurately predict the power characteristics of a given device. Such estimation is made possible using a software power model that has been trained on a reference device representative of the low powered tablet devices your application might run on.
Using the Energy Consumption Tool
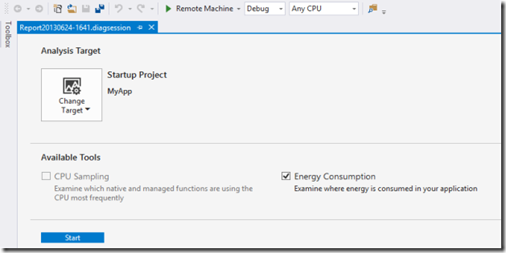
The Energy Consumption tool is one of the tools in the new Performance and Diagnostics hub available from “Debug -> Performance and Diagnostics”. Inside the Diagnostics hub you will see host of tools that are applicable for your application. One of the tools is the Energy Consumption tool that helps examine where energy is consumed in your application.

The suggested way to use the Energy Consumption tool is to profile your scenario on a low powered tablet device, as the reference device is best represented by such a device. To run a profiling session on a tablet device, Configure remote profiling on the remote device and then select “Remote Machine” as target in target selection drop down box.
In the Diagnostics Hub page, select “Energy Consumption” and press “Start”. This starts the application along with the profiling session. Go to your application and use it as you would use it normally, taking the application through the scenario that you wish to profile.

Once done, press “Stop collection” to stop the profiling session and show the Energy Consumption report.
Energy Consumption report

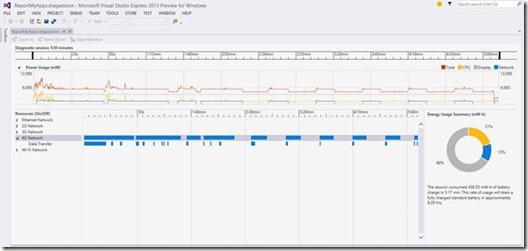
The report presents the application power/energy consumption for the given scenario. Let’s look at the various sections of the report from top to bottom referencing the screenshot above
-
Zoom: The Zoom/Selection controls above the ruler can be used to zoom in/out of a selected time range. “Clear Selection” causes the entire time range to be in scope, and that is the default as well.
-
Ruler: The Ruler indicates the duration of the scenario. The handles on the ruler can be used to scope the time range over which drill down analysis data is presented.
-
Power Usage: The “Power Usage” swim lane reports estimate of the power consumption for Display, CPU and Networking. Use the relative ordering of these line graphs to understand how Display, CPU, Networking resources are consuming energy in the profiled scenario. Check unexpected spikes of power and investigate sections of the scenario that seem to be more power hungry then the others. Together with these resources the swim lane also shows the total energy consumption graph which is the sum of these 3 resources.
-
Resources: The “Resources (on/off)” graphs which shows the on/off state of the relevant network resources. Expand the respective network on/off graphs to see data transfer details.
-
Energy Consumption Summary: A donut chart in the bottom right that provides an energy usage summary for the given scenario and the estimated battery drain.
Start Energy profiling you apps today
The Energy Consumption tool provides a powerful way to profile your application for energy, enabling the developers to understand relative power consumption of the various resource the application uses and optimize their respective usage. Subsequent posts will go into details on how to use the tool and interpret its results, but for now to see the tool in action, please take a look at our //build/ talk titled Visual Studio 2013 Diagnostics Tools for XAML-Based Windows Store Apps.
We keenly look forward to your feedback about the tool, and going forward what you would like to see in the tool. Please let us know your comments via UserVoice or Connect and by asking questions in our MSDN diagnostics forum.

0 comments