Update: Visual Studio 2013 will generate PDBs automatically when using the CPU Sampling or the CPU Usage tool in the Performance and Diagnostics hub. See this post for more details!
When profiling managed applications on Windows 8 any samples in an NGEN’d module will appear in the report as [NI module name] instead of showing the function name, which obviously makes it difficult to understand the report.
For example in the screenshot below you see [mscorlib.ni.dll], and I can see in the output window that I failed to load symbols (PDB files) for mscorlib.ni.dll even though I enabled Microsoft Symbol Servers in my Visual Studio symbol settings (I can tell that the symbol server is working, because immediately below the “failed to load” for mscorlib.ni.dll I can see that I did load symbols for twinapi.dll)

Unfortunately without symbols, you cannot see function names in native modules so all I can tell in the above screenshot is that I’m calling something in mscorlib.ni.dll but I have no idea which function I am calling; where if I’m able to get the symbol file for mscorlib.ni.dll I’ll be able to understand what I’m calling in mscorlib that is expensive. So in this blog post I will show you how to resolve this issue in four steps, but first let’s understand why this is happening.
Background
On Windows 8 the profiler uses a different underlying technology than what it does on previous versions of Windows, which is why the behavior is different on Windows 8. With the new technology, the profiler needs the symbol file (PDB) to know what function is currently executing inside NGEN’d images.
NGEN modules are native modules that are generated on the local machine from the original IL module, so there is no PDB file on the Microsoft symbol servers for framework modules. Furthermore, during NGEN on the local machine there is no PDB file automatically generated for you. Fortunately it’s possible to generate the PDB file yourself and point the profiler to it, so let’s look at the four steps necessary to do that.
Step 1: Determine where the NI module is on disk
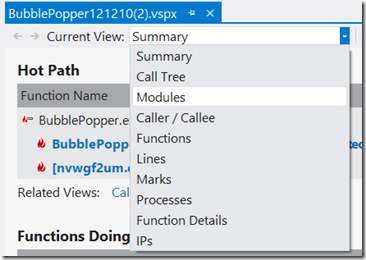
- Go to the “Modules” view in the profiler report.

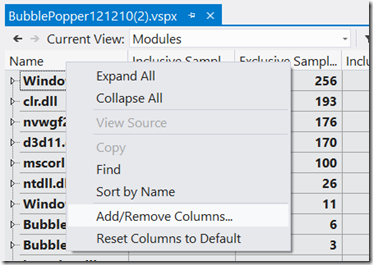
- Right click on any column header
- Choose “Add/Remove Columns…” from the context menu

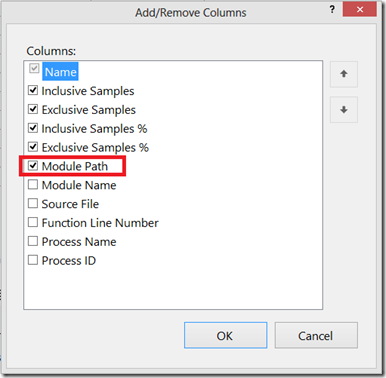
- In the dialog box that pops up, choose “Module Path”

- Click OK
The module path column now tells you where on disk the module was during collection.
Here is a screenshot from my local example:

Step 2: Create the PDB
To create the PDB, you’re going to use the Native Image Generator (ngen.exe) that ships with the .NET framework. Since NGEN’d images are native, it’s important you use the copy of ngen.exe that matches the architecture of the application you are profiling (x86/x64/ARM). For example if the application is running 64 bit on Windows 8 RTM then you would need to reference the copy of ngen.exe in “C:WindowsMicrosoft.NETFramework64v4.0.30319”
- Open a command prompt on the machine where you ran the application during profiling (if you remote profiled a Windows Store App, you have to do this on the machine you were running the app on while you were profiling. It will not work if you do it on the machine you are viewing the report on)
- Decide if you just need to see the names of the functions (use this for .NET libraries*), or if need to be able to get back to the original source file including the ability to see which lines of source code were executing most frequently in the Function Details view (only recommended for modules that are part of your project):
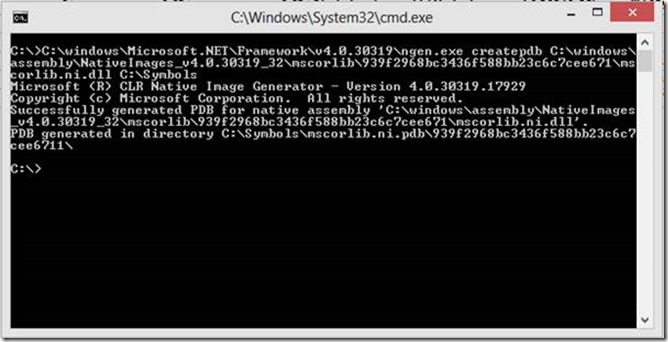
If you don’t need to get back to source then the process is very simple: In a command prompt type “[Microsoft.NET Path][ngen.exe]12 createPDB [NI module including the full path from step 1] [directory to store PDB]”, and the PDB for the NGEN’d module will be placed in the directory you specified to store the PDB
This is an example of generating an NGEN PDB for 32bit mscorlib.ni.dll

**
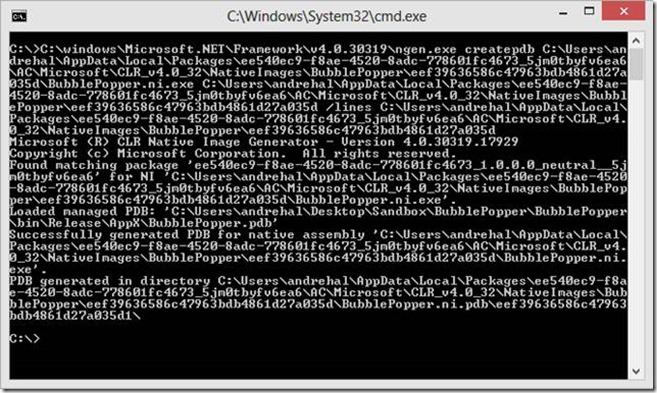
If you do need to get back to source **then you will need the PDB for the original pre-NGEN’d module. Once you’ve located that type “ngen.exe createPDB [NI module including the full path from step 1] [directory to store PDB] /lines [directory containing the original PDB]”
NOTE: ngen.exe executes within the security context of the module you are generating the NGEN PDB for. So if you are generating an NGEN PDB for a module that is part of a Windows Store App (this does not mean a framework module such as mscorlib.dll referenced by a Store App), then the output path for the NGEN PDB will need to be in a folder the app has access to (placing it next to the NI module is easiest). Similarly, if you are using the /lines flag, you will need to ensure that that the original PDB is also in a location accessible to the Windows Store app (again next to the NI is easiest). Once the PDB has been generated, you can move this to any location you like.Below is an example of generating an NGEN PDB with the /lines flag for a module in my Windows Store App.
**PDBs from the Microsoft Symbol Servers do not support the /lines flag, so will not work for generating line level information for .NET modules*
Step 3: Add the PDB to your symbol path
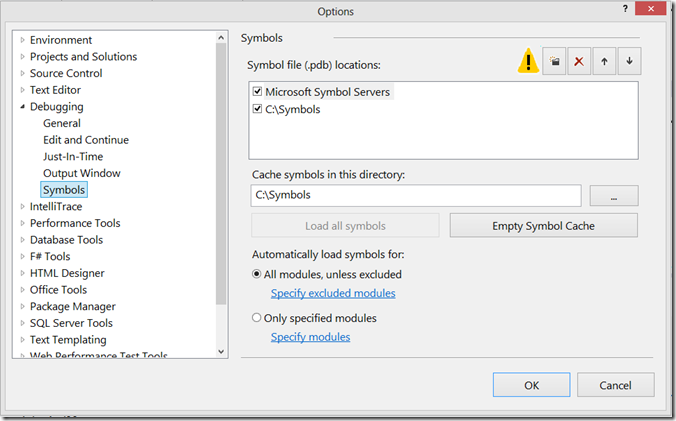
In the Symbols page, add the folders containing the NGEN PDBs you created in step 2. This is what that looks like on my machine:
Step 4: Open the profiler report
Close the report showing the [NI modules], and open it again; assuming you did steps 1-3 correctly you will now see method names instead of [NI module]. For example, using the PDBs I created in Step 2 and modifying my symbol path per Step 3, when I reopen the report that generated my original screen shot I see the following:

NOTE: The reason the “Exclusive Samples %” changed from the first screenshot, is the profiler is now able to distinguish between the individual functions inside mscorlib.ni.dll, where in the first screenshot you only see the total percentage for the entire module
In Closing
Once you’ve created an NGEN PDB for a module, all future reports will reuse the PDBs you have already created. However, if the module is updated or replaced (e.g. it is for your Window Store App and you rebuild it, or there is an update to the .NET framework), then you will need to generate a new NGEN PDB to match the new version of the module.
Hope that helps and I’d love to hear any questions/feedback that you may have so please leave a comment below.

0 comments