James Beeson, Alan Wills –
Our group runs about 20 web applications, serving a community of about 100k users spread around the world. Since we started using Application Insights, we’ve found we have a much clearer view of our applications’ performance, and as a result, our users are seeing better performing and more useful apps. This post tells you about our experiences.
We’re pretty agile. We run a three-week sprint, and we adjust our plans for future sprints based on the feedback we get from the current release.
The data we get from Application Insights broadly answers two questions about a web app:
- Is it running OK? Is it available, and is it responding promptly and correctly? Does it respond well under load? And if not, what’s going wrong?
- How is it being used? Which features are our customers using most? Are they achieving their goals successfully? Are they coming back?
We’ll focus on the first question in this post.
The team room dashboard
We keep a dashboard running in the team room. It reminds us that there are real users out there! It looks like this:
Here’s how we set up our team room dashboard:
- Use the slide show feature to show all our apps in turn.
- Use the same dashboard layout for every app. That way, we get used to the way it should look, and quickly notice anything unusual.
- Set the date range to 3 days, so we can see how things went over the weekend.
The selection of tiles you see in the screenshot are the ones we find consistently useful.
- Availability – reassures us the site is running.
- Performance index shows what proportion of requests are serviced in an acceptable time. If it dips, maybe we’re overloaded (is CPU high?) or maybe a resource we’re dependent on is having problems.
- Reliability dips if the app has uncaught exceptions. Exceptions usually show to the user as error messages, or as something failing to happen. If they happen only when the request count is high, we’ve probably got resource problems. But if we get a few all the time, it suggests that our users are finding a bug that our testers didn’t.
- The request count gives us a feel for how widely the usage varies. When it’s high, we quickly become aware of how perf and reliability are affected.
- CPU tells us if we’re hitting the endstop and should scale up.
In our weekly report for stakeholders, we quote the availability and reliability figures, with screenshots of the dashboard.
We have found that in the months since we started displaying these dashboards, we’ve become much more conscious of performance issues. Partly that’s because we’ve discovered and dealt with quite a few issues. But partly it’s just because the measurements are there all the time. They come up in discussions more often, and we think of performance more when we’re developing. As a result, our users are less likely to experience slowdowns or exceptions than they once were.
Setting up availability monitors
The first tile on the dashboard is the availability monitor. Here are our tips about availability monitors:
- Set up at least a single-URL test for your home page.
- Edit the test and set the optional extras:
- Set an alert to send you an email if any two locations fail.
- Test for a string that you’d only find in a correctly-working page. But don’t forget to update the test when you deploy a change to the page.
- Don’t switch off availability tests just because you’re planning a maintenance outage. There’s no harm in seeing the outage on the graph, and, well, it’s good to test your smoke alarm! When you take the site down, check to see that you receive an alert.
- Set up an availability test that exercises the connection to the back end server – for example it could search the catalog. But see the discussion below.
Is your back end still running?
Checking the back end by E2E availability. Some teams like to set up an availability monitor based on a web test that runs a real end-to-end scenario using a dummy account. For example, it might order a widget, check out, and pay for it. The idea is to make sure that all the important functions are running. It’s undoubtedly more thorough than pinging the home page, and it gives you confidence that your whole app is working.
But be aware of the 2-minute timeout. Application Insights will log a failure if your whole test takes longer than that. And don’t forget you’ll have to update the test when there’s any change in your user experience.
So, although verifying that your back end is running correctly is a useful function, in our team we don’t usually use availability tests for that.
Checking the back end by reliability. Instead, we set an alert to trigger if the reliability index (that’s transactions without exceptions) dips below 90%. If the SQL server goes down, the web server’s timeout exceptions will soon tell us about it.
Still, we’d agree that if you have an app that isn’t used every minute of the day, it can be nice to do a pro-active test periodically rather than waiting for some unfortunate user to discover the fault.
Build-in self tests. An interesting approach we’re trying on one of our applications uses a built-in self-test. In the web service component of this app, we coded up a status page that runs a quick smoke test of all the components and external services that the app depends on. Then we set up an availability test to access that page and verify that all the “OK” results are there. The effect is at least as good as a complex web test, it’s reliably quicker, and it doesn’t need to be updated whenever there’s some simple change in the UX.
Setting up monitoring for a live site
This is the checklist of things we set up to monitor a live application:
- Availability. At least a single-url ‘ping’ test, and preferably a back-end exerciser, too.
- Performance. Follow the setup instructions on the performance page. To monitor a live site, we don’t set any special configuration parameters in the config file. The one parameter we often set is the application display name – this sets the application name under which the data appear in Application Insights.
- Alerts. Typically we set up an alerts on availability, performance, and reliability, to let us know if anything goes weird. We also set an alert on the request count. If there’s a surge of requests for any reason, we like to keep a close eye on CPU usage and dependencies.
- Dashboard. The team room dashboard, as discussed. Developers also set up their own.
- Usage. We usually install the basic SDK and web page monitors, which give us page and user counts. (But we’ll talk about usage in a separate article.)
Reviewing and diagnosing a performance issue
In this section, we’ll show how Application Insights helps us resolve a typical issue with a production web application. We’ll put you in the driver’s seat to make it more exciting!
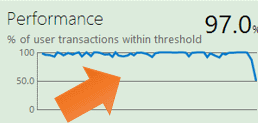
Let’s suppose you see a dip in performance:

Click on the performance tile and the server performance page appears.
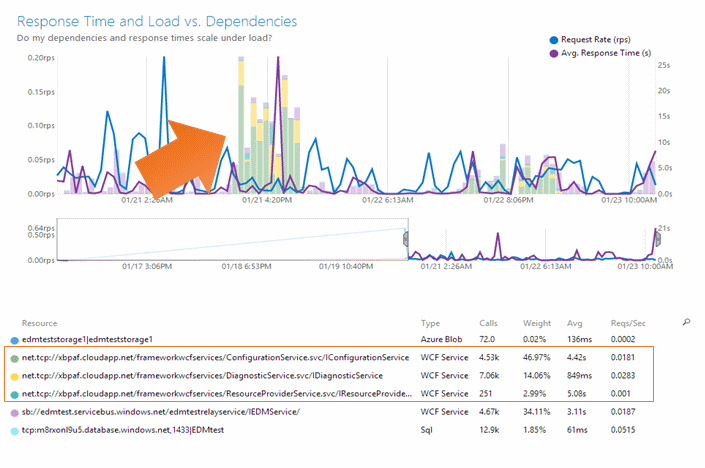
There’s an odd peak in average response time (purple line) that doesn’t seem to correspond to a peak in requests (blue line). In fact, there are earlier request peaks that don’t cause slower responses.
But you notice that there is a preceding peak in the calls made from the web server to other resources (the colored bars). Looking at the resource color keys, these are WCF services.
Zoom in on the interesting part of the chart by dragging across the small key chart.
Switch to the Diagnostics, Events page, and select Event Type=All. (Notice how the zoom is preserved as you move from one chart to another.)
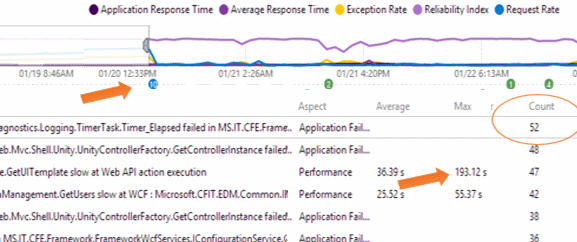
This page conveniently shows the reliability index above the table of events. Notice how it dips just after a deployment marker – the number of exceptions increased after we deployed a new version of the code.
Looking at the table, there are quite a lot of Timer Elapsed exceptions, and there are some resource calls that are taking more than three minutes. (Recall that two kinds of events appear: events that flag exceptions that users will see as failures of some sort; and performance events that flag requests that take a long time to service.)
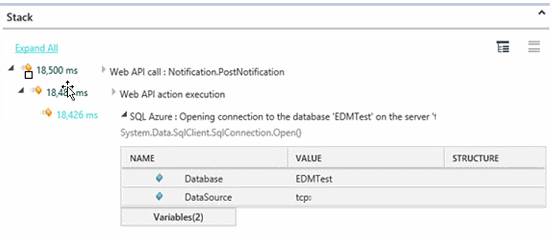
Open the event that flags the long resource calls. If you want, we can expand it first to pick a particular instance. Take a look at the stack:
Looking at several of these performance events, we find that when we drill into the call stack, there’s typically a surprisingly long wait to open a SQL Azure connection. It’s happening in one of our most frequently used MVC pages. A database connection should not take more than 100 milliseconds to open, but in this instance it’s taking more than 18 seconds.
Checking the Azure Management Portal, we notice that the SQL Azure Database and our Hosted Service (Web Roles) are running in two different locations. Every time a customer accesses this MVC page, we open a database connection across half a continent.
The cure is to host the different services in the same data cluster. To tell Windows Azure to do this, we define an affinity group in our subscription, and add to it the database and web role services. We did that, and the service calls immediately became satisfyingly swift.
Monitoring pre-production
Application Insights isn’t just for live applications. We use it for applications under development and test, too. Availability tests aren’t so useful pre-production, but the performance tests certainly are. Provided the test server can send data the public internet, the results appear on Application Insights.
There are a few things you’ll want to configure differently for testing. Edit the ApplicationInsights.config file in your web project, so that you can configure performance monitoring. Here are some of the parameters that you’ll want to change:
- Set DisplayName to avoid your test results getting mixed in with your live results. It sets the application name under which your results appear in Application Insights.
- Reduce PerformanceThreshold so that you see more events. The Monitoring Agent times all calls to your application from the web service host, and records a trace of all the internal calls, with timings. It sends that execution trace in a performance event, but only if the overall time exceeds the PerformanceThreshold, which defaults to 5 seconds. When you’re tuning the performance of your app, reduce the PerformanceThreshold so that most requests exceed it. That way, you’ll get a good sample of stack traces, so that you can see where the time is being spent. In practice, only a few events will be generated because of throttling limits imposed by the Monitoring Agent—so you don’t need to worry about a flood of events.
- Get more detailed execution traces by reducing Sensitivity. In an execution trace, data is omitted for any call that completes in less than the Sensitivity, which defaults to 100ms. Set it lower to see more calls. Beware that this might create very large event traces.
- See parameter values by setting Resources. If you want to know the actual parameter values in a call to an internal method, name it as a Resource. For example, if some calls seem to take an unusually long time, it might be useful to see what values are causing the problem.
Improving performance with Application Insights
We hope this has given you some feeling for how we set up Application Insights on our team. It helps us notice performance issues before the customers complain, and it helps us diagnose them. It also helps us get performance traces that we can use to improve performance even where it’s already mostly acceptable. In general, it’s made us more conscious of performance, and helped us create a better set of applications for our users.
Links
Performance and exception monitoring with Application Insights for Visual Studio Online


0 comments