What is it?
Application Insights SDK lets you send telemetry to the Application Insights portal, where you can find out what users are doing with your application.
0.10.0 is the latest SDK release for Application Insights. This SDK includes new functionality and new concepts in addition to a change in the basic architecture.
Data sent through this SDK will only be visible through the Microsoft Azure Preview Portal. (Previous versions sent data to an earlier edition of Application Insights, which is part of Visual Studio Online.) To find out more information about the different versions of Application Insights please see the documentation here.
You can instrument these types of application:
1. ASP.NET web applications hosted either on premises or in Microsoft Azure.
2. Windows Phone 8.0 (Silverlight) and 8.1 (Silverlight and WinRT) – UI experience is coming soon.
3. Windows Store 8.1 applications – UI experience is coming soon.
4. Logging frameworks – Capture and search trace logging messages from multiple popular logging frameworks:
b. Nlog
c. Log4Net
d. Application Insights tracing API
5. Web pages – Insert Javascript to instrument client side web code.
The easiest way to acquire the AppInsights SDK is to add it to your project using Visual Studio 2013 Update 3. Alternatively, you can manually add the NuGet packages from the public NuGet feed. For more information see
Getting Started with Application Insights.
Preview NOTE
This SDK is currently in a NuGet pre-release state. It includes new concepts and a new coding experience. Its API is evolving and will probably change in the future based on early adopter feedback.
What will it do for me?
It lets you gather information about your application’s usage and behavior in the wild. You can find out how people are using your app, understand what is failing, and identify areas for improvement. Since this is an early version, this is an opportunity for you to influence the direction of the SDK with your feedback, to make sure your requirements are addressed.
Request Monitoring
The Application Insights for Web SDK will automatically capture incoming server requests to your Asp.Net application. Collection of requests include statistics about each request, including the response time (per request, average per page, and standard deviation), total and request rate, the request URL and request failure rate.
Server Request Monitoring
Diagnostic Log Capture
The Application Insights SDKs allow for capture and analysis of diagnostic logs. Through the inclusion of a logging framework specific adapter, you can configure the SDK to automatically capture all of your existing diagnostic logs.
In addition to automatic capture from the logging framework adapters, you can also directly code against the SDK to emit basic trace messages. See the sample code below for a simple emission of a trace message.
var tc = new Microsoft.ApplicationInsights.TelemetryContext();
tc.TrackTrace(“Sample message from the Contact page action”);
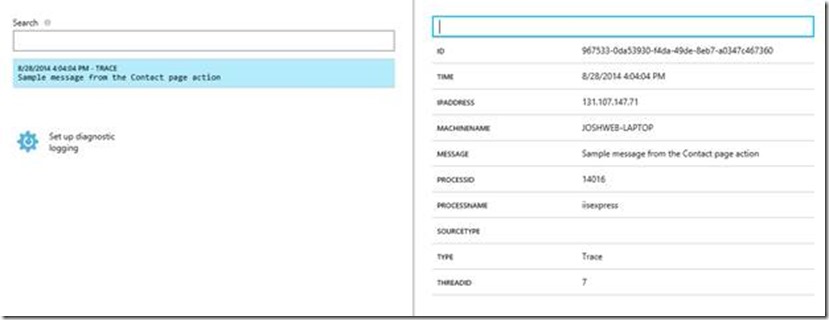
In addition to the specified message the SDK will also capture a set of automatic metadata to apply to this message. This common contextual data will assist in better understanding the telemetry and reaching richer insights. You can see below the additional contextual data captured along with this basic trace message.
Diagnostic Search Details
More information can be found on the Azure documentation site on how to Search Diagnostic Logs.
Javascript SDK
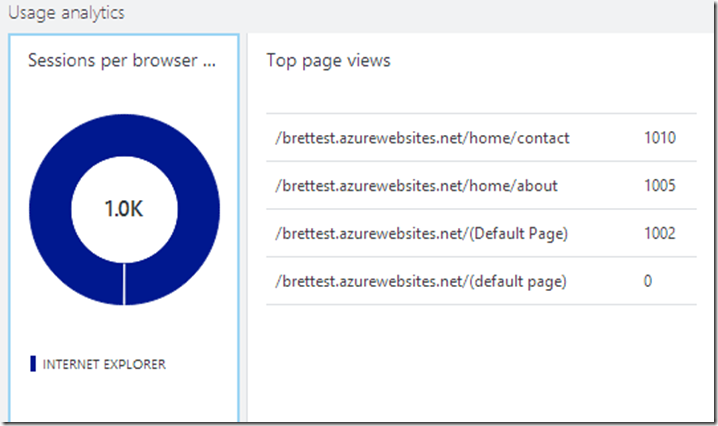
If you have included the Javascript SDK in your application web pages. You will also get out of the box collection of basic web client telemetry. Out of the box telemetry collection includes collection of page views, user sessions, page view urls, and browser versions.
Web Client Usage Analytics
Custom Telemetry API – Preview
In addition to the automatic collection of telemetry described above the latest SDK version also includes a preview implementation of a custom telemetry API. You can use this API to collect any telemetry that may be useful to you.
The core object in the API is the TelemetryContext object. Allowing you to both hold common properties to apply to all telemetry, and basic access to the telemetry logging methods. The API exposes 4 helper methods to track various telemetry. They can be accessed directly to quickly send basic telemetry.
var context = new Microsoft.ApplicationInsights.TelemetryContext();
context.TrackEvent(“My usage Event”);
context.TrackMetric(“MetricCounter”, 4.76);
context.TrackTrace(“Simple log message”);
context.TrackException(new Exception(“SimpleException”));
In addition you can create more complex telemetry by creating a telemetry item directly.
var complexEvent = new Microsoft.ApplicationInsights.EventTelemetry();
complexEvent.Name = “ComplexEvent”;
complexEvent.Properties[“CustomProperty”] = “AnyString”;
complexEvent.Metrics[“Metric1”] = 42;
complexEvent.Metrics[“AnotherMetric”] = 1.234;
context.Track(complexEvent);
We support 4 core telemetry types today. They all share a common design pattern, e.g. all have the ability to add custom properties, but each has a unique set of properties that better match the use scenario.
· Event – Used to track discrete actions. Most often used to track user behavior actions.
· Metric – Used to compute numeric aggregation of values.
· Trace – Used when the primary data is a message string and consumption of that string will be through textual search.
· Exception – Used to collect data about a thrown exception, including details like stack trace and throwing location.
NOTE: This API is a preview release and is intended to capture feedback and is subject to breaking change in future SDK releases. Not all these telemetry types will be available for visualization in the UI.
Windows Phone and Windows Store Apps – Preview
Both Windows Phone 8.0/8.1 and Windows Store 8.1 application are supported with dedicated NuGet packages. Both packages provide a similar set of functionality. Through simple addition of the NuGet package to your app you will get automatic collection of session starts, application crashes, page views, and the ability for custom telemetry described above. In addition, all telemetry will have additional properties collected automatically, identifying data such as anonymous used id, device id, device model, geo location, screen resolution, etc.
NOTE: The pre-release NuGet packages collect all data described above, batch the data for transmission only on application startup / resume, and transmit to the AppInsights service. Currently the UI visualization support for Windows Phone and Windows Store Apps is still coming soon. While the data from these packages will be collected and transmitted, there is currently no UI visualization of that data available.


0 comments