You’ve always been able to see some performance counters in Metric Explorer: Process CPU, Available Memory, and so on. Windows has lots of other performance counters, and you may also have defined your own custom counters. And now with the latest Application Insights SDK for web apps you can collect any performance counters you choose – both from the standard set and your own custom counters. This means you can:
- Make and share a collection of charts on which you can watch how your business is running and how your app is performing. (Have you noticed you can save and share metric pages as favorites now?)
- Set alerts that email you if any counter/metric crosses a specified threshold over a period of time.
- Slice and dice your performance counters along with other server side/client side/usage metrics, and drill through to specific events for diagnostics.
Configure Collection of Custom Performance Counters
Note: Please ensure that you are using SDK version 0.14 or higher.
Specify the custom performance counters you would like to collect in ApplicationInsights.config. For example, let’s suppose you’ve defined a category of counters called Sales, in which there are counters for the number of items sold, number of sales per second, average order price, and so on. Categories can have named or numbered instances, and your app creates instances for different sales departments. You’d like to have the ability to display some of those counters in Application Insights. You also want to be able to display a standard Windows perf counter that we don’t collect by default:

- The format is CategoryName(InstanceName)CounterName. For counters that do not have instances, it is just CategoryNameCounterName.
- These counters will be collected and reported as custom metrics. By default, the metric will be named “CategoryName – CounterName”. For instance, the 3rd counter above will be reported as the custom metric called “Objects – Processes”
- If you provide a ReportAs name, we will use that as the name of the metric instead of the concatenated string “CategoryName – CounterName”.
- You should provide a ReportAs name if the counter name contains characters that would be invalid in a metric name. Currently, metric names may only contain letters, round brackets, forward slashes, hyphens, underscores, spaces and dots.
- If an instance is specified, that will be collected as a custom attribute (CounterInstanceName) of the reported metric.
You could also do this in code. This snippet would need to be run at application start-up.


Explore: View Custom Performance Counters with other metrics
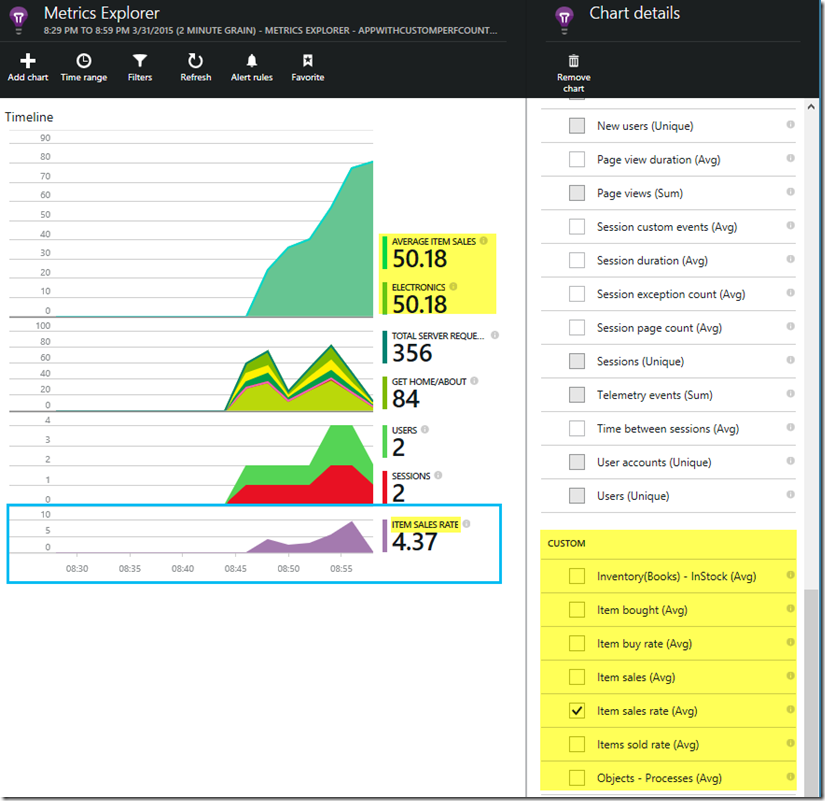
As mentioned above, the custom performance counters are reported as custom metrics. You can click on a chart to configure it, and scroll down to find the custom counters available:

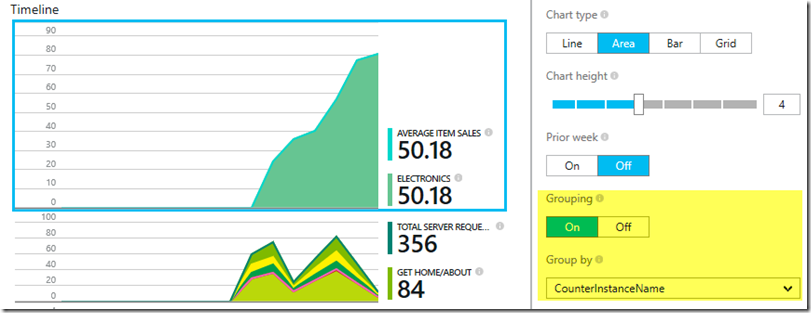
You can segment the metric on “CounterInstanceName”:

Alert on Custom Performance Counters
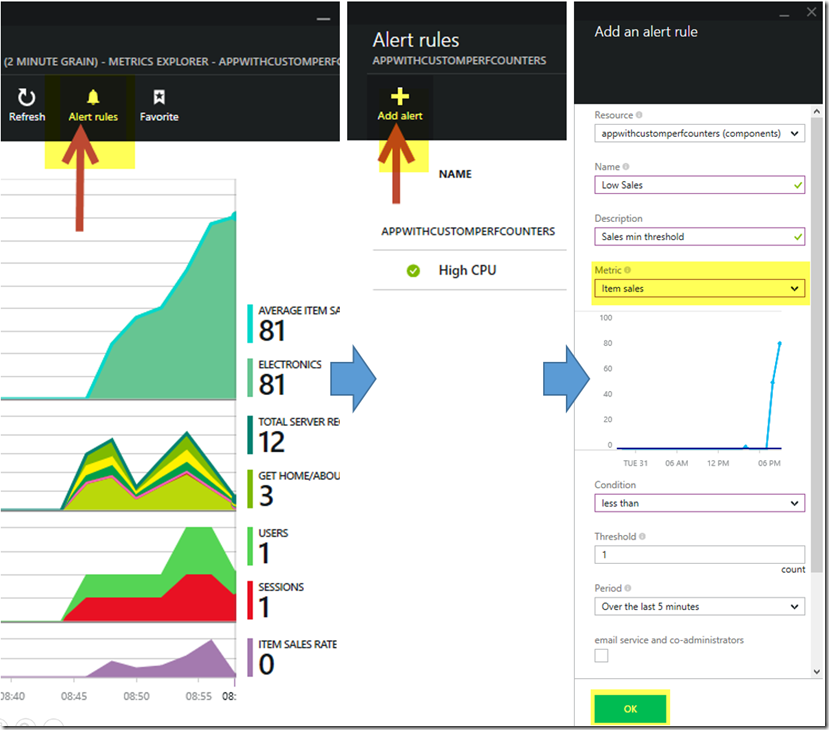
As with any metric you may be reporting by calling TrackMetric – you can alert on those collected from custom performance counters. Just click on “Alert rules” and then “Add alert”:

Diagnostics
The standard/custom performance counters are aggregated at source and reported every minute. They should typically be available on the portal in under 15 minutes. If you do not see a configured counter reported over a long time, there could be a problem with its configuration. We add trace messages to your application to help you detect/fix the problem. These trace messages will be prefixed with “AI:” as shown in the 2 examples below. These will be available along with any of your own traces in the Diagnostic Search Explorer results.
Issue: Configured counter wasn’t found. Please check configuration:

Issue: Multiple counters were given the same alias. Please provide distinct “ReportAs” aliases

Custom vs Default Performance Counters
The following counters are collected by default. These are grouped under the “Performance Counter” category. This article is about all other performance counters – which if configured, will be reported as custom metrics, and will be grouped in the “Custom” category in the Metrics Explorer.
|
% Process CPU |
The percentage of elapsed time of all process threads used by the processor to execute instructions for the application’s process. |
|
Available Memory |
Physical memory immediately available for a process or for system use. |
|
ASP.NET request rate |
Rate of all requests to the application per second from ASP.NET. |
|
Exception rate |
Exceptions thrown per second. |
|
Process private bytes |
Memory exclusively assigned to the monitored application’s processes. |
|
Process IO rate |
Total bytes per second read and written to files, network and devices. |
|
ASP.NET Request execution time |
Execution time of the most recent request. |
|
ASP.NET Requests in application queue |
Length of the application request queue. |
|
% Processor time |
The percentage of time that the processor spends in non-Idle threads. |
Summary
As this article illustrates, with some quick configuration you can easily leverage existing custom windows performance counters. You will be able to use the features of Metric Explorer to relate trends in custom performance counters with other server side, client side and custom telemetry. You can also set up alert rules for when the counter trips a threshold over a period of time. These enable a compelling monitoring and diagnostics experience.
Looking forward to your feedback to help us improve and be effective in keeping your applications available, performing and successful with your users!

0 comments