Azure WebSites is a popular “fully managed Platform-as-a-Service (PaaS) that enables you to build, deploy and scale enterprise-grade web Apps in seconds” (see more about Azure WebSites here). Application Insights is a preview service available in the Azure Preview portal designed to help development teams get 360° views of their applications across Availability, Performance and Usage with fast & powerful troubleshooting, diagnostics and usage insights. While Application Insights could be used to understand if your web App was available and successful when deployed as an Azure WebSite the ability to get deep application performance management (APM) insights was limited and was a popular ask on the Application Insights user voice.

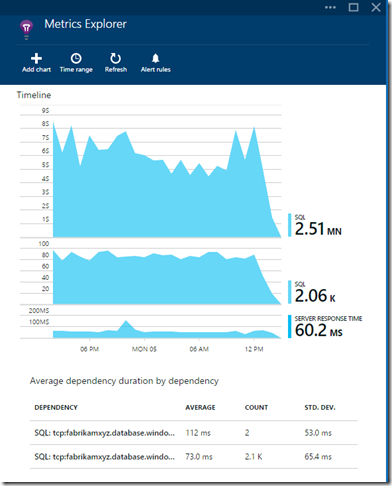
Introducing the Application Insights Azure WebSite extension…..now it is possible to enable deeper performance management scenarios when your web App is deployed to an Azure WebSite. After enabling the Azure WebSite extension (detailed steps below) you’ll be able to see statistics and details on your codes application dependencies. These application dependencies are automatically discovered. Below is screenshot that shows the amount of time spent in a SQL dependency including the number of SQL calls and related statistics such as the average duration and standard deviation.
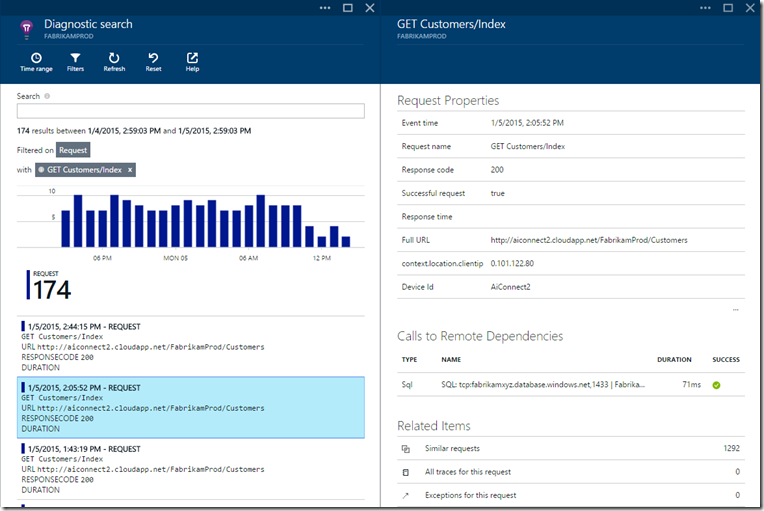
Also see calls to your code remote dependencies from individual requests:
If you have an Azure WebSite and would like to enable Application Insights follow these steps:
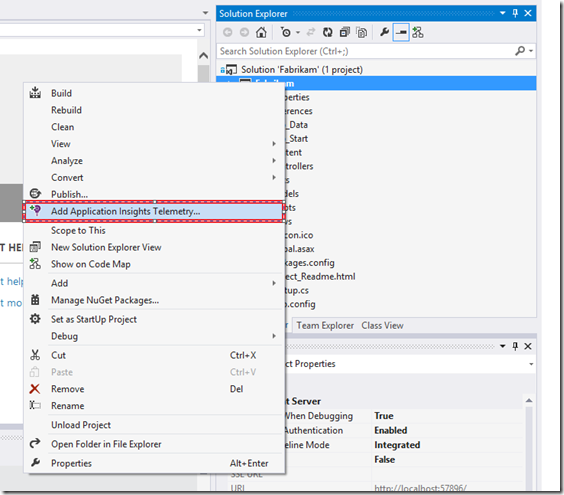
1) Onboard your application to Application Insights from Visual Studio 2013 Update 3 or later and deploy to an Azure WebSite.
Note: If your application onboarded to Application Insights already ensure you are using the .12 SDK (or later). See this post here for instructions on how to update the SDK version.
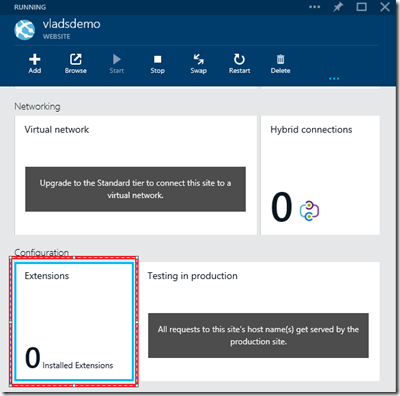
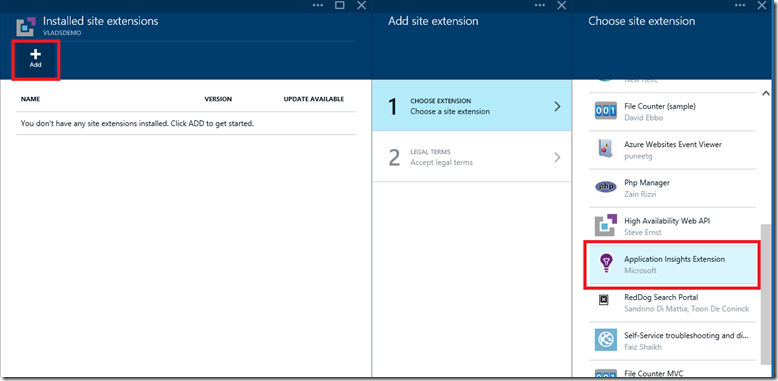
2) Enable the Application Insights Extension on the Azure WebSite blade (not the Application Insight blade) for the website that was enabled for Application Insights with the .12 or later SDKs:
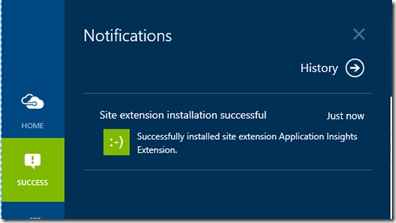
Ensure the extension is successfully installed through the notification:
3) Now the extension is enabled execute a few requests against your web App and navigate to your Application Insights resource blade:
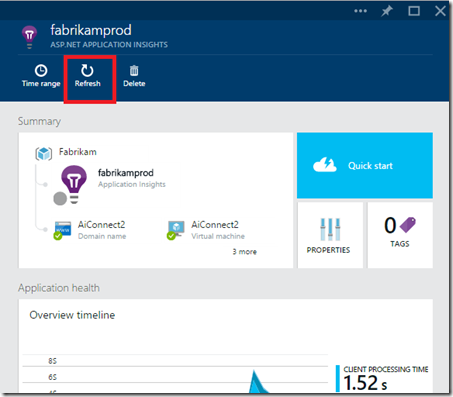
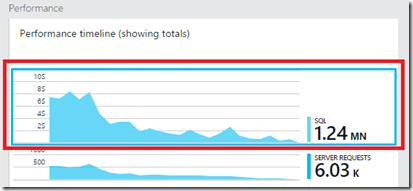
Scroll down to the Performance lens and drill into the first or second chart to drill into the Metrics Explorer to see your code dependencies:
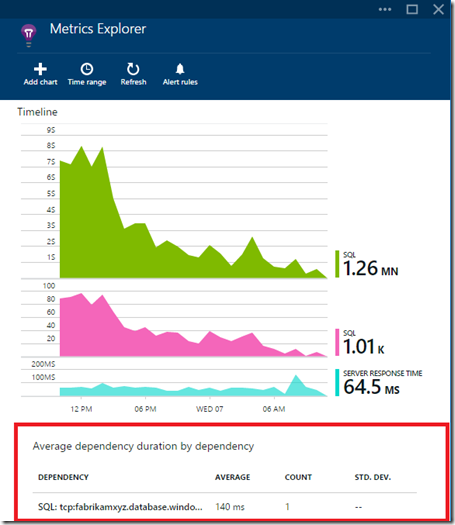
Now you can use Application Insights for APM scenarios against your Azure website web Apps and understand if performance issues are due to your app code or a dependency your app uses.
For questions and/or feedback, please visit the Application Insights Forum and for feature requests check out our User Voice!
**Notes: **
- If you have an application that you’d like to enable to Application Insights but do not have a visual studio project for it (eg. it is a gallery based app) here’s a blog post by Sergey Kanzhelev on a workaround to use: http://apmtips.com/blog/2014/12/28/application-insights-extension-for-azure-websites/
- The Application Insights extension works for Azure WebSites that are using .NET. There is early support for other technologies including Node.JS, PHP, Python and a gallery site: WordPress.
Troubleshooting:
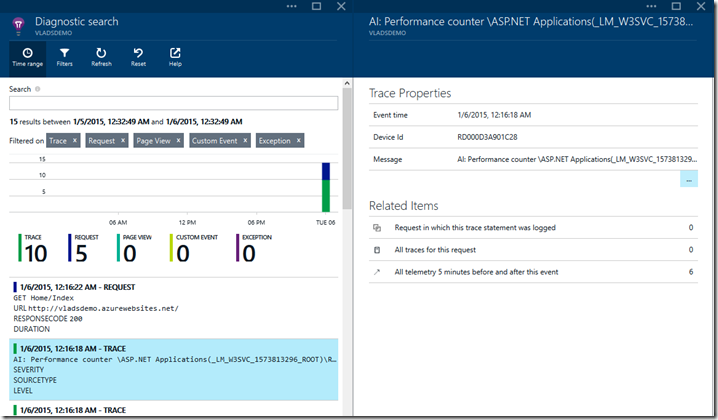
- Windows Performance counter collection isn’t supported on an Azure WebSite. You will see the following trace messages from diagnostic search:
AI: Performance counter ASP.NET Applications(_LM_W3SVC_1573813296_ROOT)Request Execution Time has failed to register with performance collector. Please make sure it exists. Technical details: Failed to register performance counter. Category: ASP.NET Applications, counter: Request Execution Time, instance: _LM_W3SVC_1573813296_ROOT.
To configure Application Insights to not collect the default set of Performance Counters remove this line from ApplicationInsights.config.

0 comments