With the release of Windows 10 we also shipped Visual Studio Tools for Windows 10. As you will have heard Universal Windows apps written in .NET (either C# or VB) will be compiled to native machine code before being deployed to customer devices using .NET Native. However, the default Debug configuration still uses .NET Core runtime to allow for a fast edit->compile->debug cycle. You always need to test with the actual code generation and runtime technology your application will use when running in production as it can expose bugs you might not be able to find with your development configuration (e.g. race conditions that manifest due to different performance characteristics). To facilitate this, when you choose the Release build configuration your app is compiled using the .NET Native tool chain.
If you don’t find any issues with the .NET Native build of your application, great! However if do you run into any issues that require you to debug there are a few things to note:
- When you are debugging an app built with the .NET Native tool chain you will be using the .NET Native debug engine which has some capability differences from normal .NET debugging
- The Release configuration will be using code optimizations that will impact debugging
- Variable inspection of runtime types will be slightly different
Code optimizations
If you run into an issue when testing the Release configuration that you need to debug it is important to note that the Release configuration is by default fully optimized code (e.g. code inlining will be applied in many places). These optimizations will have a significant impact on the debugging experience including unpredictable stepping and breakpoint behavior (due to code inlining) and the inability to inspect most variables due to memory optimizations.
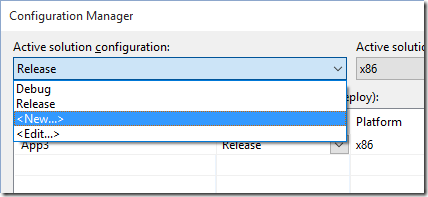
This means you will want to debug a non-optimized .NET Native build. This fastest way to do this is simply to disable optimizations (covered below), however we recommend creating a new build configuration so your existing Debug and Release configurations continue to work the way you expect. To do this open the “Configuration Manager” from the build configuration dropdown.

Then from the “Active solution configuration” dropdown choose “<New…>”

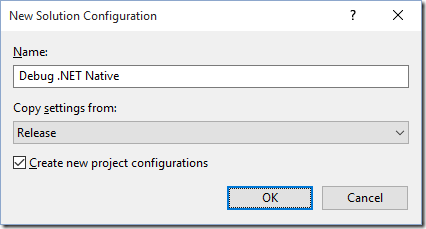
Give it a name you will understand (e.g. “Debug .NET Native”) and choose “Copy settings from Release” and click “OK”

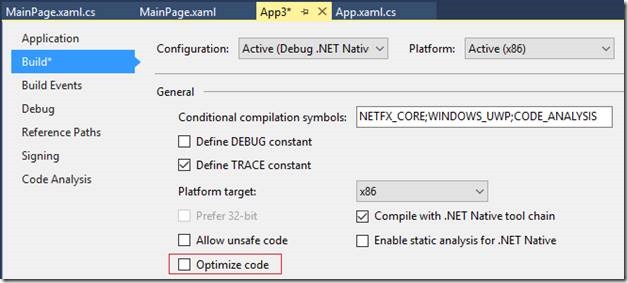
Open the project’s property page, and on the build tab uncheck “Optimize code”

You now have a build configuration you can easily switch to for debugging .NET Native specific issues. Assuming you can reproduce the issue with the non-optimized build this will yield a much better debugging experience.
Inspecting Runtime Types
One thing that will be different from debugging normal JIT based .NET applications is that when inspecting objects from the Windows Runtime (including XAML UI Elements) you will see a “[Native Implementation]” node. In order to inspect the elements properties you will need to look under this node (this is due to the fact that these objects are actually implemented in native code and are accessed via a thin .NET wrapper). When looking at this node, if you did not enable Microsoft Symbol Servers in your symbol settings you will see a message saying “information not available no symbols loaded for [module name]”. Right click on the “[Native Implementation]” frame and choose “Load Symbols”, the debugger will then download them from the Microsoft Public Symbol servers.

Once symbols are loaded you will be able to inspect the property values from the “[Native Implementation]” node. For example, to see the value of the “Text” property on a Textbox object you need to look under the “[Native Implementation]” node—this does mean that if you hover over “textbox1.Text” in the editor while debugging .NET Native you won’t see a DataTip.

Summary
You likely won’t need to spend much time debugging your code compiled with .NET native, but when you do remember to disable code optimizations and that many properties for runtime types will require looking at the “[Native Implementation]” node. As always we want to hear how the debugging experience is working for you, and how we can improve it. So please let me know in the comments section below, through Visual Studio’s Send a Smile tool, or via Twitter.

0 comments