
Feature Representation for Text Analyses
Emotion Detection and Recognition from text is a recent field of research that is closely related to Sentiment Analysis. Sentiment Analysis aims to detect positive, neutral, or negative feelings from text, whereas Emotion Analysis aims to detect and recognize types of feelings through the expression of text, such as anger, disgust, fear, happiness, sadness or surprise. Emotion Analysis has many useful applications such as gauging how happy our citizens are, or enabling pervasive computing to tailor responses to the individual. Using machine learning, an application could use Emotion Analysis to suggest help when anxiety is detected, or to tailor a response to how a consumer feels about a product or service.
Text analysis applications use an n-gram, where n may be 1, 2, 3 and so on, in their classification algorithms. However, it is often unclear how n will affect the overall performance of a text-based classification system. In this code story, we systematically compare the overall accuracy of a text-based emotion classifier using logistic regression focused on short informal English text messages.
What is an n-gram?
Let’s take this sentence as an example:
“Time lost is never found.”
| Where n=1, | Where n=2, | Where n=3, | ||
|---|---|---|---|---|
| that is a uni-gram | that is a bi-gram | that is a tri-gram | ||
| Time | Time lost | Time lost is | ||
| lost | lost is | lost is never | ||
| is | is never | is never found | ||
| never | never found | |||
| found |
In the case of a uni-gram, each word is examined on its own, whereas bi-grams and tri-grams provide some context by examining neighboring words. For example, “found” means the opposite of “never found”; “lost” does not tell us what is being lost, whereas “time lost” provides us more insight about what is lost. Punctuation can also be included.
But, just how many grams should be used? Does examining more neighboring words in a sentence improve performance?
In this code story, we use logistic regression to understand how the use of a uni-gram, bi-gram or tri-gram impacts the performance of a classification task on the application of emotion analysis from text (informal English short messages – see here). Logistic regression can be thought of as a single neuron in neural network. Performance may differ with standard written text; in fact, strategies employed may differ.
The data
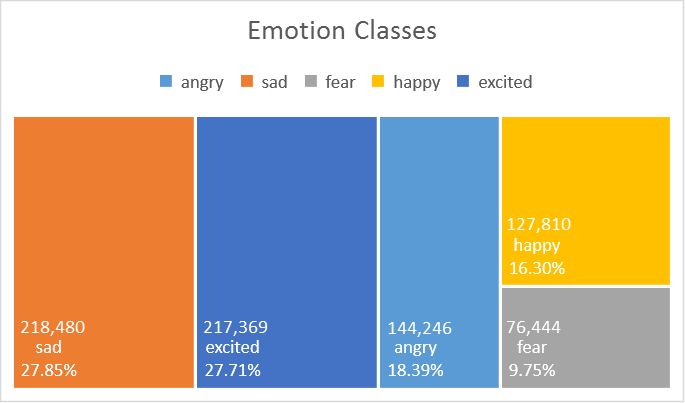
The dataset (see here for details) used in this experiment consists of 784,349 samples of short informal English messages (a collection of English tweets), with 5 emotion classes: anger, sadness, fear, happiness, and excitement, (see figure below) where 60% is used for training, 20% for validation and 20% for testing. The following experiments only use training and testing sets. This is currently a private dataset.
Feature representation
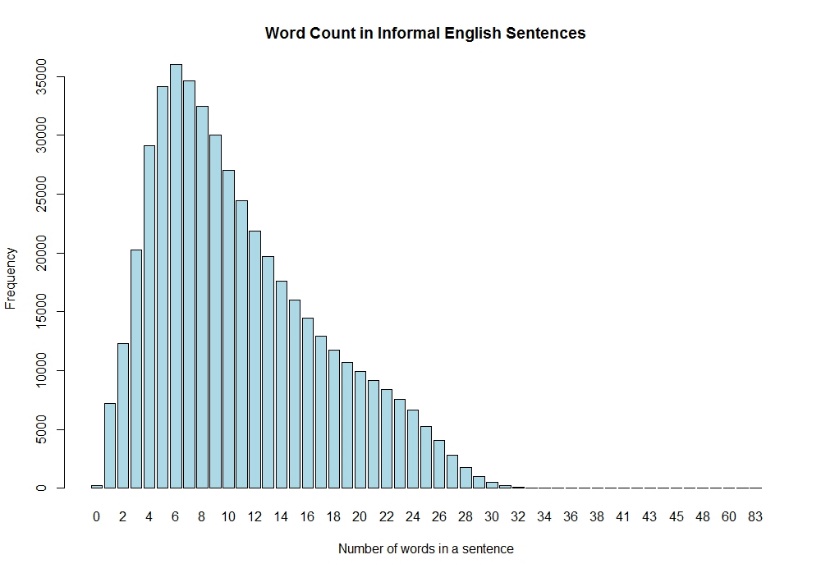
In this code story, we are experimenting with n-gram values of 1 to 10, to understand the effect the n value has in the case of emotion classification. Here we stop at 10-gram due mainly to the short texts in the database, which have an upper limit of 140 characters (at the time this experiment is carried out), which comes to approximately 24 words per sample. In this database, most sentences contain 6 words, as shown in the figure below. It is possible to use a combination of, say, a 1-gram and 2-gram, or a 2-gram and 3-gram, for example, though this is not covered in this experiment.
Results and Discussions:
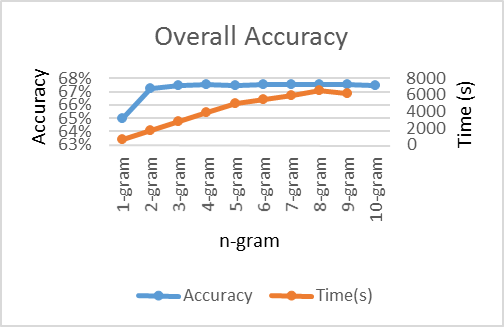
The graph shows that the greatest increase of overall accuracy happens for 2-gram over 1-gram, then the performance plateaus as n increases. Accuracy is the total number of correctly predicted instances over all the instances in a test dataset. We also see computational time increase as n increases. It is likely that some cases of negation are captured when considering more than one word, for example, “happy” vs “not happy”. Where computing resources are available, this is a simple experiment to try out to get a sense of how neighboring words should be considered for a classification task at hand, before trying it out on more sophisticated algorithms, such as in a neural network.
Have you ever wondered:
- How a more sophisticated learner fares against a simpler one, such as a neural network against a logistic regression? See here.
- How data distribution would affect performance? Notice that the distribution of classes in this dataset, they are imbalanced. Some classes are naturally similar to another. For example, happy and excited, simply because the way we express those feelings, are more similar as compared to either of them to angry. How could confusion between classes arise? See here.
- How the number of neurons in a fully connected neural network can affect performance? How about the number of hidden layers? See here
The Details:
Toolkit
Microsoft internal machine learning toolkit.
Experiments settings:
| Settings | Values | |
|---|---|---|
| Learner Type | Multi-Class Logistic Regression | |
| Linear combination of L1 and L2 regularizations | Coefficients of 1, 1 | |
| Optimization Tolerance | 1E-07 | |
| Memory Size (L-BFGS) | 20 | |
| Feature Normalization | Min-max normalizer | |
| Initial Weights Scale | Random | |
| Max Number of Iterations | 1000000 |
Full results:
Full results can be found at https://github.com/ryubidragonfire/Emotion
 Light
Light Dark
Dark
0 comments