
Data preparation: The balancing act
A typical machine learning task consists of problem specification (asking the right question), data collection, data preparation, feature representation, modelling, evaluation, and visualization. It is hardly surprising that low performance is to be expected, if data of low quality is to be provided; rubbish in, rubbish out. It is crucially important to exercise due diligence to ensure the quality of each and every phase, especially the first few, as later phases are dependent on the earlier ones, and errors do propagate fast.
There are many processes that help to improve the performance, such as pinpointing the right kind of data to be collected, reducing systematic error during the process of collection by adjusting collection methodology, cleaning data, feature engineering, algorithm tuning and so on. Here, we investigate how data preparation can impact the performance of an emotion classifier based on informal short English text messages using logistic regression with a bi-gram as a feature representation (see The Details section for experiment settings).
The data
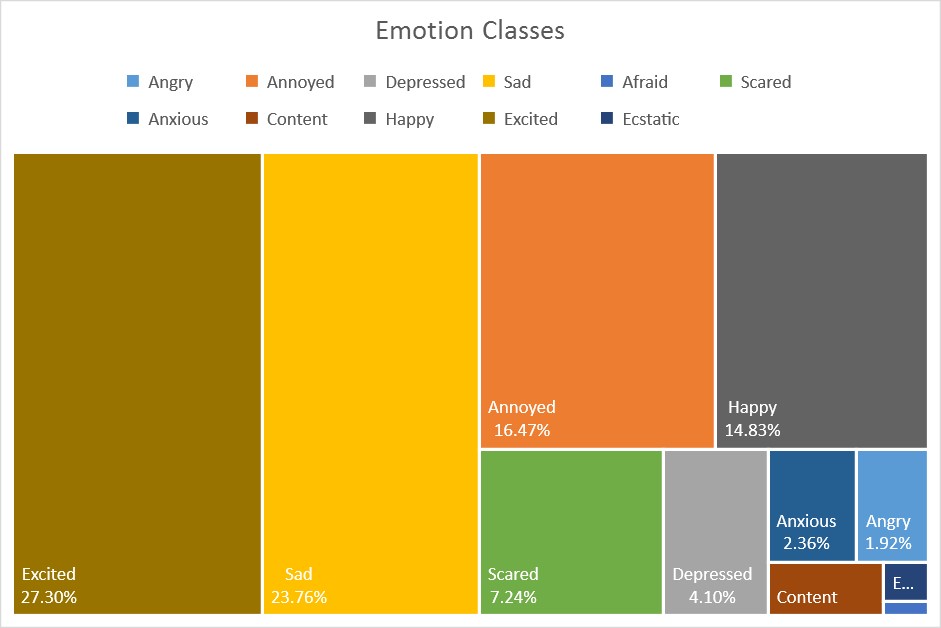
The dataset used in this experiment consists of 784,349 samples of short informal English messages (a collection of English tweets), with 11 emotion classes: angry, annoyed, depressed, sad, afraid, fear, anxious, content, happy, excited, ecstatic where 60% is used for training, 20% for validation and 20% for testing. This set of experiments only require the training and testing sets. The figure below shows the data distribution over all of the classes. Content (1.46%, 11,48.1), ecstatic (0.42%, 3,259), and afraid (0.15%, 1,146) are too small to be included in the figure. At the time of writing, this is a private dataset.
The figure below shows the confusion matrix of the 11 emotion classes, together with respective recall rate and precision. The overall accuracy, as measured by weighted accuracy, is 62.58%; the unweighted accuracy is just 32.1%. Weighted accuracy is computed by taking the average, over all the classes, of the fraction of correct predictions in this class (i.e. the number of correctly predicted instances in that class, divided by the total number of instances in that class). Unweighted accuracy is the fraction of instances predicted correctly (i.e. total correct predictions, divided by total instances). The distinction between these two measures is useful especially if there exist classes that are under-represented by the samples. Unweighted accuracy gives the same weight to each class, regardless of how many samples of that class the dataset contains. Weighted accuracy weighs each class according to the number of samples that belong to that class in the dataset. Here, recall refers to the true positive rate, frac{text{true positive}}{true positive + false negative} , while precision refers to frac{text{true positive}}{true positive + false positive} .
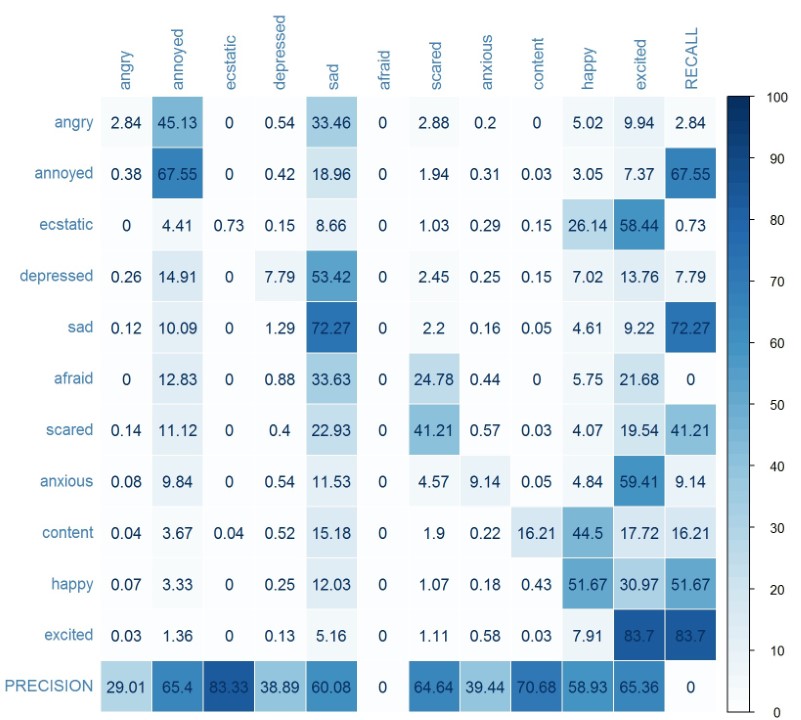
The recall rate for annoyed, sad, excited are the highest, whereas angry, ecstatic, depressed, and anxious are poor. For afraid, the recall rate is just 0. The result implies that this model is only good for classifying certain emotions, and has no chance of getting afraid correctly classified. The top three emotions have the top three largest number of training samples, and afraid has the least training samples. Is that a coincidence?
At the first glance, this dataset is far from perfect. The emotion class afraid has 690 samples, only contributing to 0.15% of the training data, while excited, sad, annoyed and scared each have over 100,000 samples; excited has the most, with over 200,000 samples. This will no doubt introduce bias to the training process.
Another aspect of the problem is the granularity of emotion classes. Solely through the expression of text, with the absence of voice intonation and facial expression, it is hard enough for humans to distinguish these emotions with 100% accuracy, let alone a model. There is also an inherent challenge of extracting the context of a short message. Depending on the requirements of the application, such classification may be too finely tuned. If that is the case, closely related classes can be combined.
The ‘new’ data
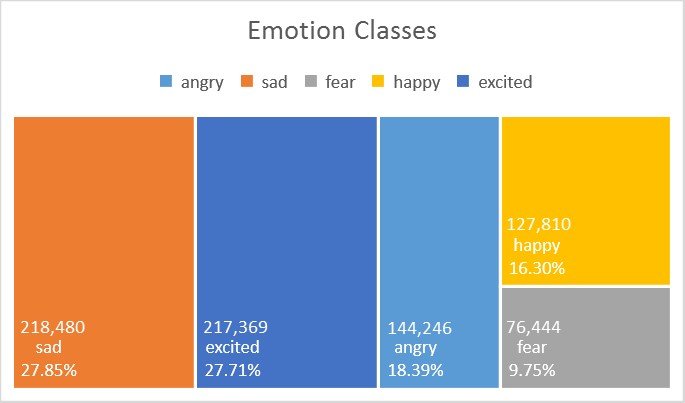
By combining classes, in this case, the number of training samples for each classes become more balanced, and yield an improved dataset. The figure above shows the distribution of a ‘new’ dataset with a reduced number of 5 emotion classes, by combining similar classes in the manner shown below. This is simply re-labelling the samples; for example, sentences which are originally labelled as ecstatic are now labelled as excited.
| Original Classes | New Classes | |
|---|---|---|
| angry, annoyed | angry | |
| depressed, sad | sad | |
| afraid, scared, anxious | fear | |
| content, happy | happy | |
| excited, ecstatic | excited |
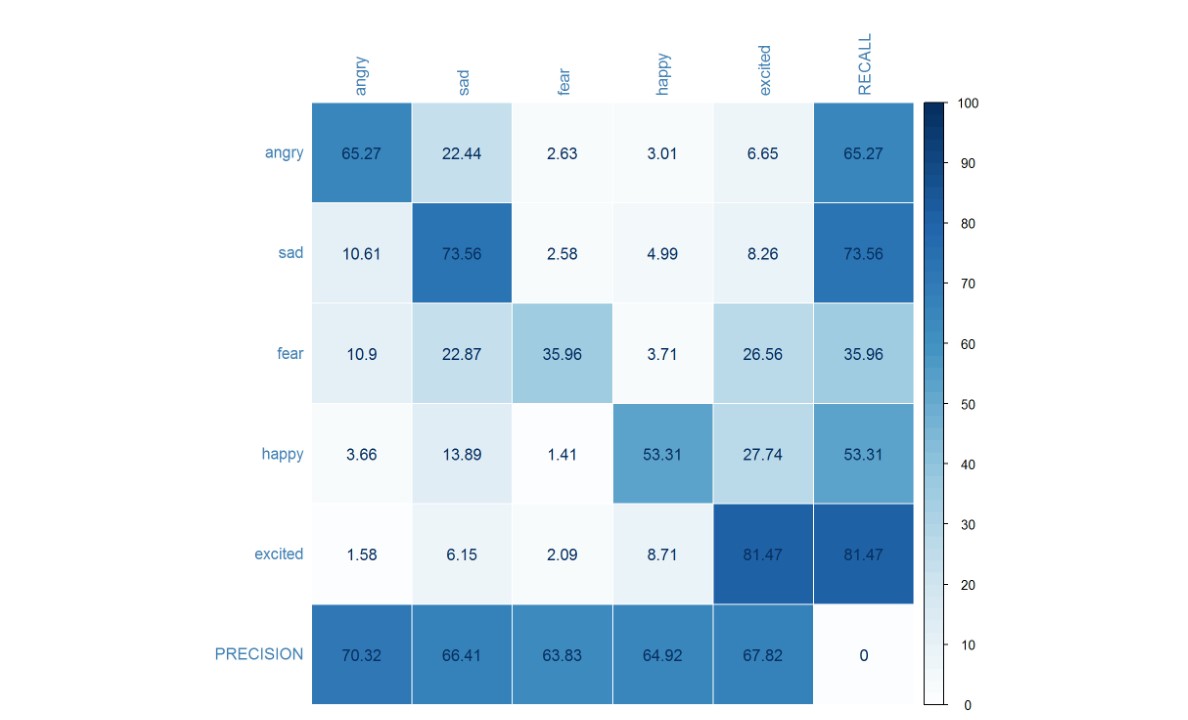
The unweighted accuracy is 67.20%, while weighted accuracy is 62.91%, an impressive improvement indeed, with approximately 5% and 30%, respectively. This shows that careful consideration during data preparation can indeed influence the system performance, even though the raw data is actually identical! The confusion matrix above also shows improvement over precision for all classes, with recall rate above 50% except for fear; this is most often confused with sad or excited. The confusion matrix for the 11 classes of emotions also portrays similar tendencies.
What happens if we have a balanced dataset; that is, each class has an equal number of samples (in this case 20% each)?
The balanced data
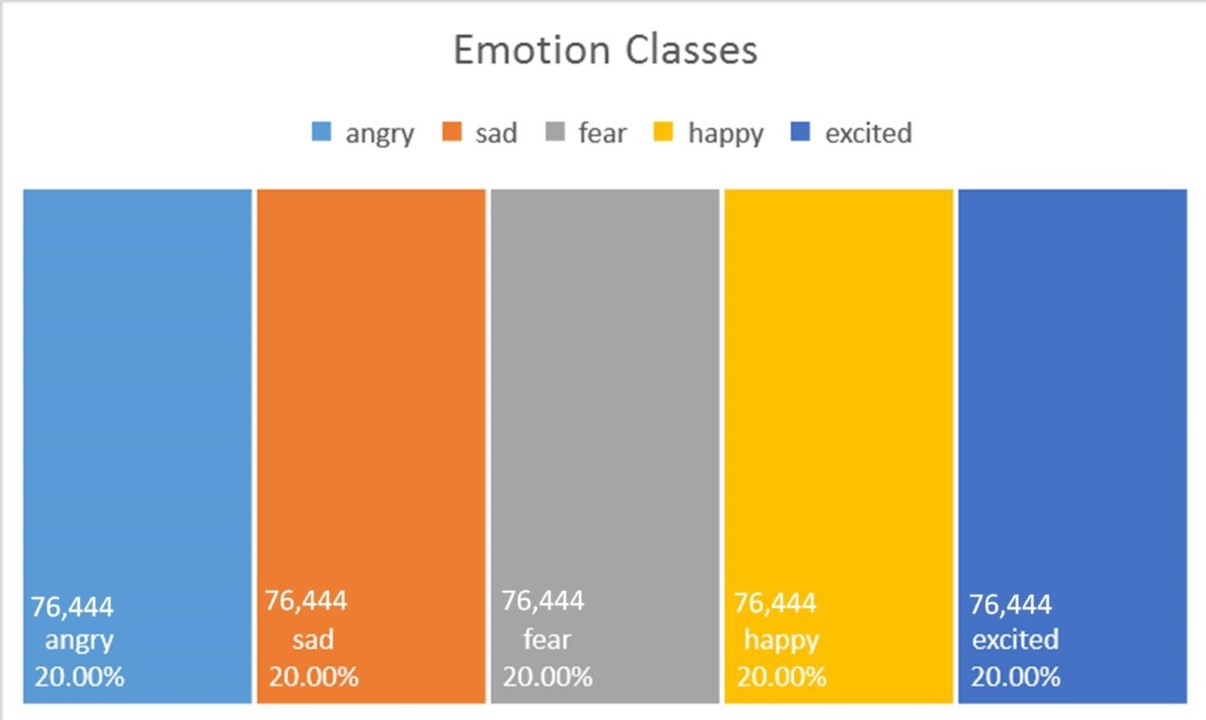
The figure above shows the distribution of the balanced data set of 5 emotion classes as before. Here, we randomly sampled 76,444 samples from angry, sad, happy and excited, giving a total of 382,220.
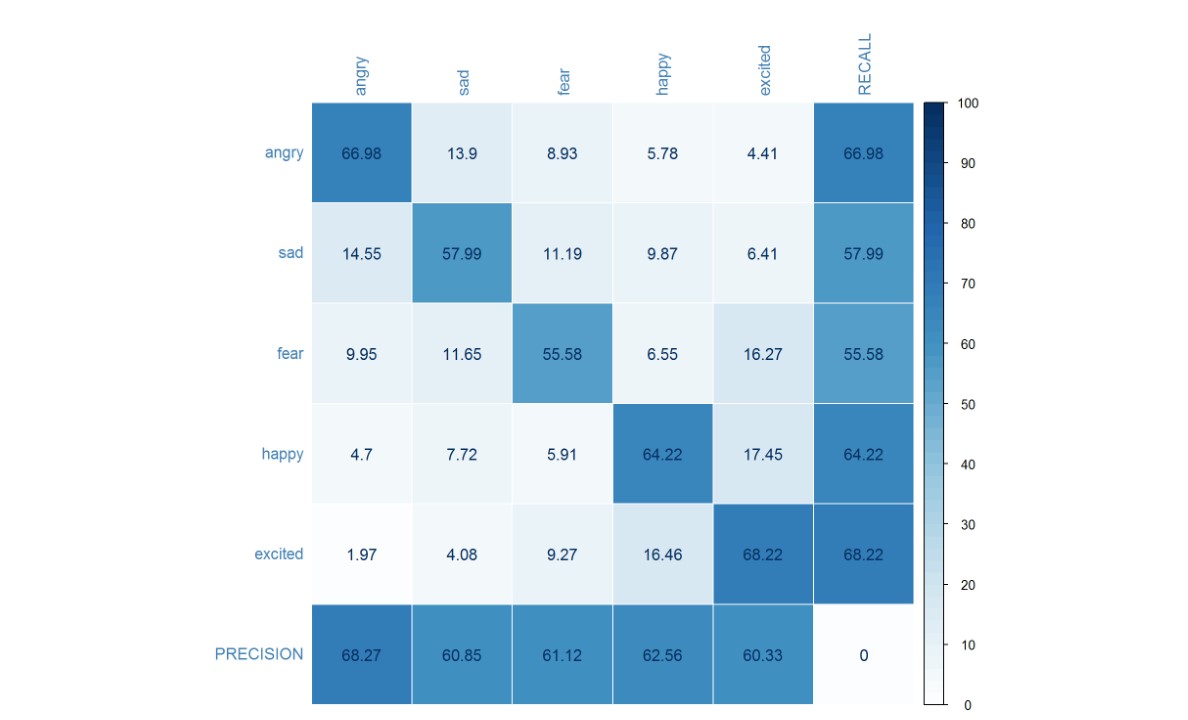
The figure below shows the confusion matrix for the classification result using the new, balanced, data set. The weighted accuracy is 62.59% while the unweighted accuracy is 62.60%, with significant improvement on recall for the fear and happy emotion classes. Although the unweighted accuracy is similar, the confusion matrix shows that the classifier trained using the balanced dataset is more robust, as it has the ability to correctly identify all 5 classes with a minimum recall rate of 55%, whereas the previous classifier does well in recognizing excited and sad, but not so well in recognizing fear.
Summary:
This code story shows that data preparation can indeed influence the overall performance of a classification system. Due diligence is essential to ensure that data used is of the highest possible quality. This experiment also shows that knowing your data well allows you to groom your data to get the most insightful results. Changing the way you prepare your data may lead you to re-think and re-phrase your original question, which may ultimately help you develop a more successful model.
Have you ever wondered:
- How text-based feature representations, such as uni-gram, bi-gram and tri-gram can impact performance in a classification task?
- How the number of neurons in a fully connected neural network can impact performance? How about the number of hidden layers?
- How much performance gain can we expect from a simple algorithm compared to a more sophisticated one? For example, a single neuron versus a fully connected neural network?
The Details:
Toolkit:
Microsoft internal machine learning toolkit.
Experiments settings:
| Settings | Values | |
|---|---|---|
| Learner Type | Multi-Class Logistic Regression | |
| Linear combination of L1 and L2 regularizations | Coefficients of 1, 1 | |
| Optimization Tolerance | 1E-07 | |
| Memory Size (L-BFGS) | 20 | |
| Feature Normalization | Min-max normalizer | |
| Initial Weights Scale | Random | |
| Max Number of Iterations | 1000000 |
Hi. Is it possible if i could have access to this dataset? I want to use it for my college project in different model