Introduction
As a part of the VS2013 preview release the ‘Performance and Diagnostics Hub‘ was introduced. The Profile Guided Optimization (PGO) tool is a new performance optimization tool that integrates with ‘Performance and Diagnostic Hub‘. The tool is not a part of the out of the box install of Visual Studio 2013 but can be downloaded and installed from VSGallery (Download here). This tool is for you if care about boosting your application’s runtime performance.
This tool aims at improving the user experience of carrying out PGO in Visual Studio by providing a guided experience through the various phases of the PGO process. In addition to this, the PGO tool will also provide functionality currently only exposed when using PGO from the command line. This includes being able to train disjoint training sets and making use of PGO utilities such as ‘pgomgr‘ to view and analyze the quality of training performed for the training phase of PGO.
The net goal of using this tool is to collect training data which represents performance centric scenarios. This training data is then used to optimize future builds of your application made possible as the plugin changes the resultant build configuration to always build with PGO.
Please note, with this tool now you can also PGO’ize modern or immersive applications for the Windows Store. This tool is only available for native applications and is currently enabled for x86/x64 platform. As mentioned earlier, this tool is currently not a part of out-of-the-box install of Visual Studio. It is a prototype that we are really hoping if you can provide us feedback to help getting it to the next stage. Please let us know what you think about it?
Walkthrough
The tool is available for use as a part of the ‘Performance and Diagnostics Hub‘ as long as a solution with a native startup project is selected in solution explorer. To start the tool, select ‘Profile Guided Optimization‘ and click ‘Start‘ as shown in figure 1 below:
Figure 1: ‘Profile Guided Optimization’ tool in ‘Performance and Diagnostic’ hub.
The ‘Start’ screen for the plugin provides an overview for the process involved in PGO’izing your application. The ‘Analysis Target’ always points to the ‘startup project’ in your solution. The three simple steps are ‘Instrumentation’, ‘Training’ and ‘Analyze’.
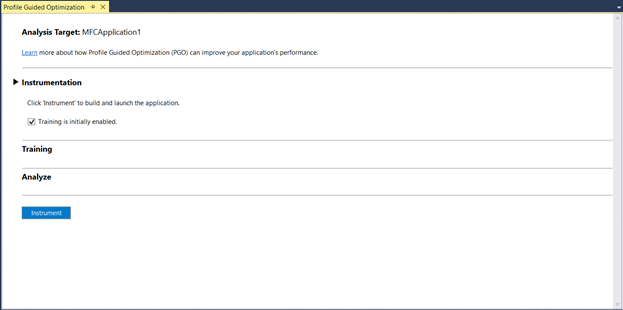
Clicking ‘Start’ begins the ‘Instrumentation’ step for the tool as shown in figure 2. below.
Figure 2: Instrumentation step for Profile Guided Optimization (PGO)
‘Training is initially enabled’ option provides the user with a choice to include the startup phase of the application as a part of the training exercise. In other words if this option is de-selected no training data will be collected for the startup or any other phase of the application until training is explicitly enabled.
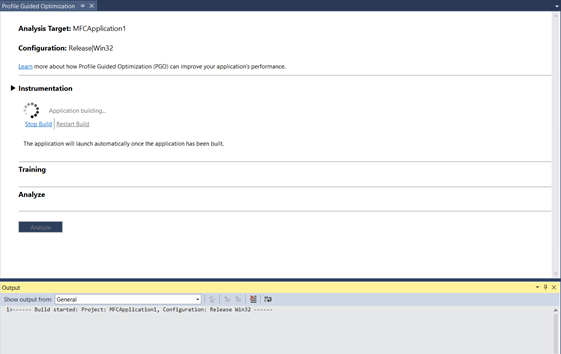
Clicking ‘Instrument’ will launch an instrumented build for the application (Figure 3). For the instrumented build the application is built with a special set of build flags. During this build the compiler inserts probe instructions into the generated code which are used to record training data for the training phase. Once the instrumented build of the application is complete, the application is launched automatically.
If you see any warnings pop up, please take time to address them and then click ‘Start’ again to begin the instrumentation phase for the plugin.
Figure 3: Instrumented build started
The ‘Start/Pause’ training links are used to control collection of training data (figure 4). The performance gains that you will get from PGO are directly proportional to how well you train your application. If you are unsure how to train your application or what constitutes a good set of training scenarios try using performance test suite as your training scenario set. Every ‘start/pause training’ sequence essentially marks the period where training data is recorded (figure 4). The training data recorded is dumped to a PGO data file (<startup_project_name>.pgd) which is finalized together during the analyze phase of the PGO lifecycle. Once the training phase is complete, click ‘Analyze’ to start analyzing the training data collected.
Figure 4: Training phase for Profile Guided Optimization
In the analyze phase of PGO, the training data collected is merged together and the table presents the amount of time spent (Dynamic Instruction Count (%)) in each function exclusively along with additional information such as function call count (Figure 5). This table provides data which is similar to what a profiler reports and should be used to validate that performance centric code sections are included as a part of the training step.
The compiler uses this training data collected to optimize for application performance. With PGO, functions that are hot (i.e. frequently executed) during the training session are optimized for speed, the rest are optimized for size. As a result with PGO the resulting binary is smaller and faster.
Figure 5: Analyze phase for Profile Guided Optimization
Once the training data collected has been reviewed, click ‘Save changes’ to enable future application builds to build with PGO. If however based upon your review, key performance centric functions seem to be missing from the table or are associated with very low dynamic instruction count (%), click ‘Redo Training’ to redo the training phase of the application. Please note, clicking the ‘Redo Training’ button resets the training data collected.
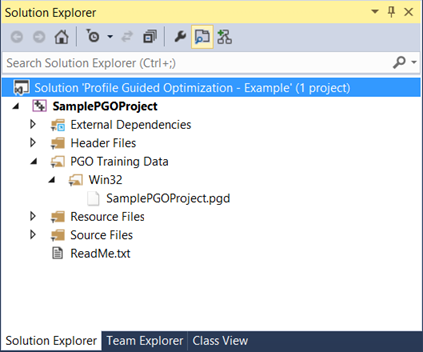
As a result of clicking ‘Save changes’ the tool dumps the training data collected into a PGO data file (<startup_project_name>.pgd. The PGO data file is written in a new folder called ‘PGO Training Data’ created under the ‘startup project’ head as depicted in figure 6 below. This data file is used by the compiler to enable a PGO compile.
Figure 6: Profile Guided Optimization Data file (<startup-project-name>.pgd)
At this point ‘Profile Guided Optimization’ is enabled for the chosen build configuration and can be initiated by an application rebuild. On application rebuild take notice of the extra PGO related diagnostic information in the Build Output window (Figure 7).
Figure 7: Profile Guided Optimization diagnostics in Build Output
As you make significant code changes to your application code base it will become necessary to retrain your application to regenerate a new PGO training data file. It is recommended to retrain your application when the highlighted PGO diagnostic information falls below ‘80%’.
To view the performance benefits with PGO, re-execute your training scenarios with the PGO-optimized build of the application to notice the performance gains.
Wrap Up
We are really looking to learn from your feedback w.r.t this tool so please leave us a note on what you think of it once you get a chance to play around with it. Ideally we would like to make this part of the product in a future release of Visual Studio.
For more information about what PGO is all about please refer to one of my earlier blogs. For more information about this tool please visit this link on MSDN. Additionally, if you would like us to blog about some other compiler technology or tool please let us know we are always interested in learning from your feedback.


0 comments