
Azure Cosmos DB is designed for high throughput and low latency workloads, with the ability to serve millions of requests per second and billions of requests a day. In addition to seeking a scalable database that can serve massive volumes of traffic, users also look for granular server-side metrics for monitoring the health and performance of their mission-critical workloads built on Azure Cosmos DB.
Azure Cosmos DB can be integrated as an opt-in feature with Azure Log Analytics – an Azure service that provides querying, monitoring, and alerting capabilities for Azure metrics.
However, with billions of requests to the database, coupled with the need to retain this data for application performance analysis, the data footprint of these metrics can start to add up. While Log Analytics only charges for storage, not for the compute required for querying and retrieving metrics, the cost of ingestion and retention of these metrics can get large for a high throughput database.
Savings with the new pipeline
Azure Cosmos DB recently launched improvements to significantly reduce the cost of the Log Analytics integration, by migrating to a new metrics pipeline called Resource Specific tables. Previously, all Azure services pushed metrics to a common table in Log Analytics, which made the format of these tables rigid. Furthermore, additional data was needed to distinguish metrics for each service in the common platform, leading to a higher footprint for metrics.
By moving to the new pipeline, Azure Cosmos DB metrics are now available in “Resource Specific” tables with a schema of their own. This has significantly lowered the data footprint and by extension, lowered the cost of ingestion and retention of Azure Cosmos DB metrics in Log Analytics.
With a simple toggle in the UI along with minor changes to the queries, metrics can now be retrieved through Log Analytics at a significantly reduced cost. Tabulated below are cost savings for the most frequently used diagnostic settings in Azure Cosmos DB.
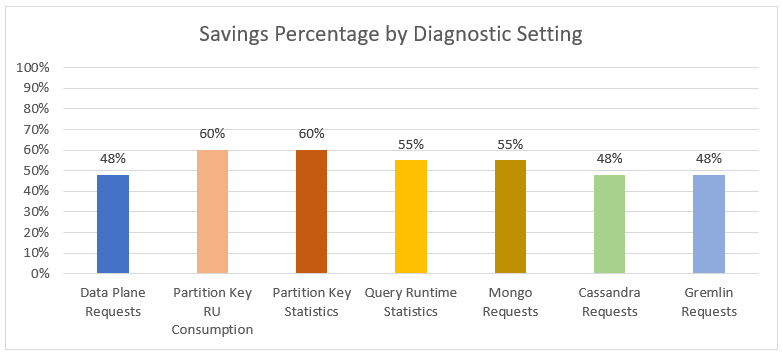 Figure 1: Expected savings for each Diagnostic Setting capturing server-side metrics for Azure Cosmos DB
Additional Improvements
Previously, all metrics were published as strings requiring the casting of numeric values. Additionally, column names for different categories of diagnostics were not uniform. With resource specific tables, naming conventions are consistent and numeric fields no longer need to be cast to be queried effectively.
Querying Server-Side Metrics
Detailed below are a flowchart and queries, highlighting performance monitoring with Log Analytics.
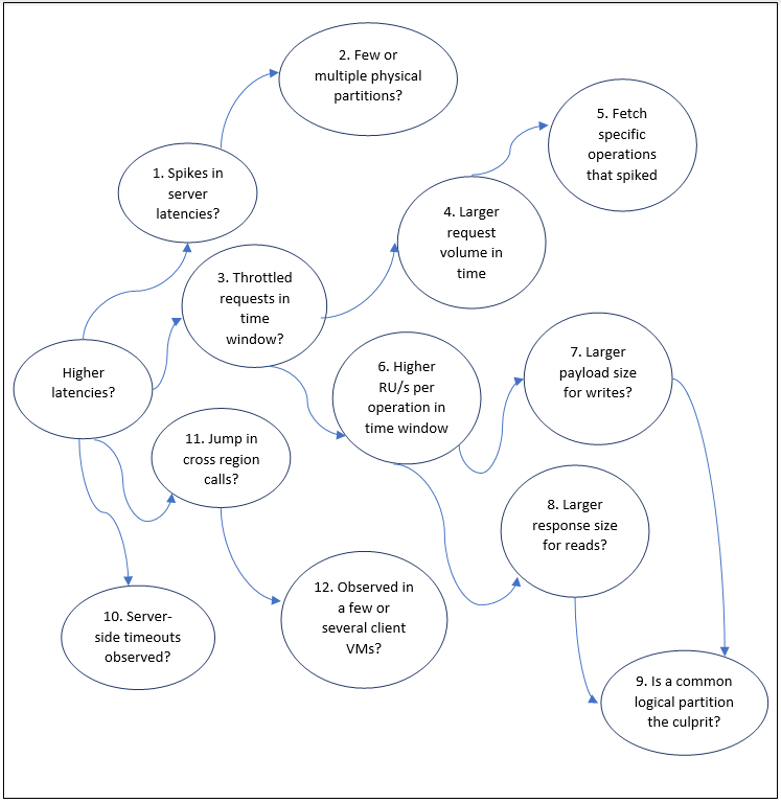
Figure 2 – Flowchart for debugging application latencies by leveraging Azure Cosmos DB metrics in Log Analytics
Log Analytics (Resource Specific) Queries for each of the steps above:
- Spikes in server latencies?
CDBDataPlaneRequests
| where TimeGenerated > now(-6h)
| where AccountName == "LA-METRICS-DEMO"
| summarize max(DurationMs) by bin(TimeGenerated, 10m)
| render timechart
- Few or multiple physical partitions?
CDBDataPlaneRequests
| where TimeGenerated > now(-6h)
| where AccountName == "LA-METRICS-DEMO"
| summarize max(DurationMs) by bin(TimeGenerated, 10m), PartitionId
| render timechart
- Throttled requests in the time window?
CDBDataPlaneRequests
| where TimeGenerated > now(-6h)
| where AccountName == "LA-METRICS-DEMO"
| where StatusCode == 429
| summarize count() by bin(TimeGenerated, 10m)
| render timechart
- Larger request volume in time window?
CDBDataPlaneRequests
| where TimeGenerated > now(-6h)
| where AccountName == "LA-METRICS-DEMO"
| summarize count() by bin(TimeGenerated, 10m)
| render timechart
- Fetch specific requests that spiked
CDBDataPlaneRequests
| where TimeGenerated > now(-6h)
| where AccountName == "LA-METRICS-DEMO"
| summarize count() by bin(TimeGenerated, 10m), OperationName
| render timechart
- Higher RU/s per operation in time window
CDBDataPlaneRequests
| where TimeGenerated > now(-6h)
| where AccountName == "LA-METRICS-DEMO"
| summarize max(RequestCharge) by bin(TimeGenerated, 10m), OperationName
| render timechart
- Larger payload size for write operations?
CDBDataPlaneRequests | where TimeGenerated > now(-6h) | where AccountName == "LA-METRICS-DEMO" | where OperationName in ("Create", "Upsert", "Delete", "Execute") | summarize max(RequestLength) by bin(TimeGenerated, 10m), OperationName | render timechart - Larger response size for reads?
CDBDataPlaneRequests | where TimeGenerated > now(-6h) | where AccountName == "LA-METRICS-DEMO" | where OperationName in ("Read", "Query") | summarize max(ResponseLength) by bin(TimeGenerated, 10m), OperationName | render timechart - Is a common logical partition the culprit?
CDBPartitionKeyRUConsumption
| where TimeGenerated > now(-6h)
| where AccountName == "LA-METRICS-DEMO"
| summarize sum(RequestCharge) by PartitionKey, PartitionKeyRangeId
// 9.1 Is a common logical partition consuming more storage than others?
CDBPartitionKeyStatistics
| where TimeGenerated > now(-6h)
| where AccountName == "LA-METRICS-DEMO"
| summarize StorageConsumed = sum(SizeKb) by PartitionKey
| order by StorageConsumed desc
- Server side timeouts observed?
CDBDataPlaneRequests
| where TimeGenerated >= now(-6h)
| where AccountName == "LA-METRICS-DEMO"
| where StatusCode == 408
| summarize count() by bin(TimeGenerated, 10m)
| render timechart
- (&12) Jump in cross region calls? Observed in a few or several client VMs?
// Confirm the regions against which Client IPs are sending requests to Cosmos DB
// Setting the region name in the SDK's 'UserAgent' can also be used to check for cross region calls
CDBDataPlaneRequests
| where TimeGenerated >= now(-6h)
| where AccountName == "LA-METRICS-DEMO"
| summarize count() by ClientIpAddress, RegionName
Next Steps
To learn more about the new resource-specific tables in Azure Log Analytics see, Monitoring Azure Cosmos DB with Resource Specific Tables in Log Analytics.
Also, stay tuned to this blog for an upcoming post on monitoring client-side performance through diagnostic metrics in the Azure Cosmos DB Java v4 Client
0 comments