Ever wonder what was run in that Console window that briefly appeared on your screen? In this guest post, Craig Loewen – our awesome summer intern explains how you can find out what command-line applications run on your machine. Over to you Craig …
[This article includes samples from Nathan Gau’s Blog on Using SCOM to Capture Suspicious Process Creation]
At some point during any user’s time using Windows, they have probably had a Console Window pop open for a millisecond and then disappear, leaving them to wonder ‘What was that?’.
I had exactly the same experience which led me to investigate, answer that question, and reveal a way to obtain a list of every process that attached itself to a console window!
For some background, a console window (running as ConHost.exe) opens & is attached to a command-line application when executed. When Windows launches a new process, an event with ID 4688 is generated. This event is disabled by default, and needs to be turned-on through a Group Policy Object setting before it can be tracked.
Enabling Console Window Creation Events to be Recorded
Note: Take a minute to consider whether you should enable command line auditing before doing so. Nathan Gau wrote a blog post about this where he detailed the following:
“[enabling command line auditing] will generate a lot of security events. If you have tools such as ArcSight, Splunk, OMS, or SCOM collecting these events, you’d be wise to do this incrementally to ensure that you aren’t overloading these tools, and I’d add that if you don’t have a plan in place to review and respond to what you find, then you should think about that before you start turning on auditing that won’t be looked at. The other problem is that by turning on command line auditing, anyone that can read security events could read the contents, and potentially read something sensitive. So please, think this through carefully. A full write up on TechNet can be found here.”
Once you are sure that this is the right course of action for your system, enabling command line auditing is very straightforward. Full instructions can be found here, but let’s step through the process:
Here are some screenshots of how to enable logging on your system.
1) First, open the Group Policy Editor: hit start, type “group”, and hit the “Edit Group Policy” item in your search results.
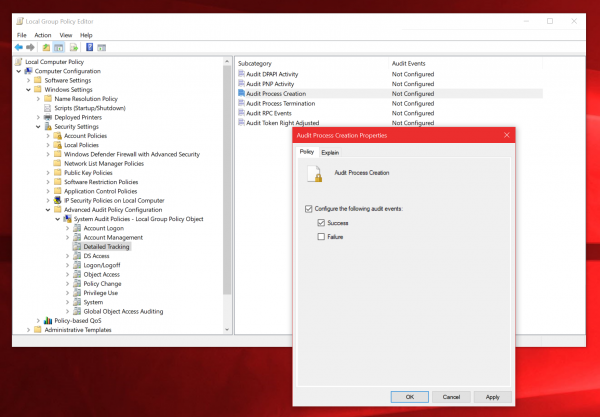
2) Enable Audit Process Creation:
Navigate to:
Local Computer Policy
Computer Configuration
Windows Settings
Security Settings
Advanced Audit Policy Configuration
System Audit Policies
Detailed Tracking
Double click the “Audit Process Creation” item, check the “Success” box and hit OK.
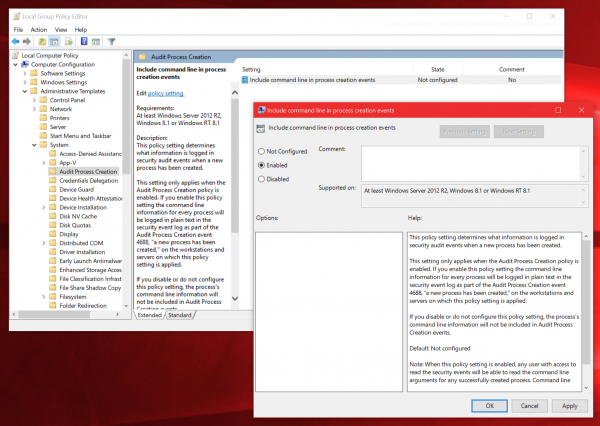
3) Enable command line process creation
Navigate to the following items:
Local Computer Policy
Computer Configuration
Administrative Templates
System
Audit Process Creation
Double-click the “Include command line in process creation events” setting, select the “Enabled” field and hit OK.
Be sure to reboot your PC so that process tracking is fully enabled. After rebooting, your machine should now start logging process creation events.
Let’s find and view these process creation events:
Viewing the List of What Created a Console Window
You can view process creation events in one of two ways, either with PowerShell, or Windows Event Viewer.
In PowerShell
Open a PowerShell window with administrative privileges, this is necessary to access the logs. Then simply type the command:
Get-WinEvent Security | ? id -eq 4688 | ? { $_.Properties[5].Value -match 'conhost' } | Select TimeCreated,@{ Label = "ParentProcess"; Expression = { $_.Properties[13].Value } } | Select -First 10
The number at the end of the command (currently 10) determines how many processes to show you before PowerShell stops looking for them.
In Windows Event Viewer
If you prefer a GUI based approach, it is also possible to view this list in Windows Event Viewer. Open Event Viewer and create a custom view:
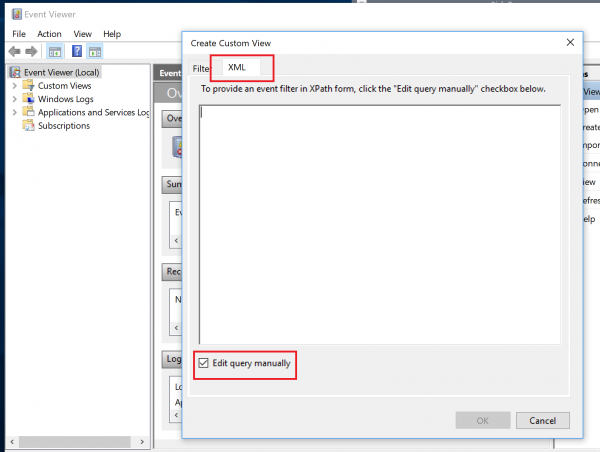
Navigate to the XML tab and click ‘Edit Query Manually’ and press ‘OK’ on the dialogue box that will open:
Into the text box, paste the following piece of XML:
<QueryList>
  <Query Id="0" Path="Security">
    <Select Path="Security"> *[System[(EventID=4688)] and EventData[Data[@Name='NewProcessName'] and (Data='C:\Windows\System32\conhost.exe')]]
    </Select>
  </Query>
</QueryList>
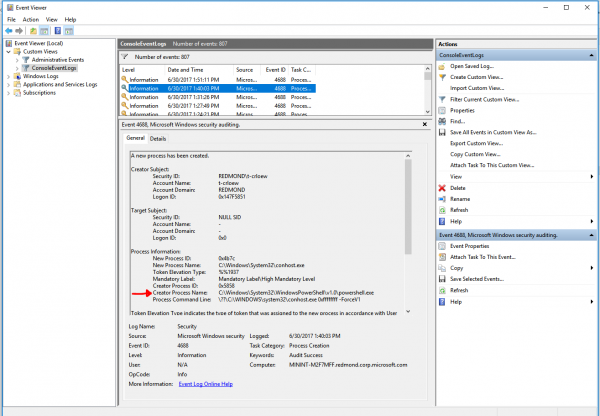
Press OK, give your Custom view a name and description, and then you should see items inside of the event view. To find out what process created the console window click on an item and look at the ‘Creator Process Name’:
Finishing Up
Once you’ve finished recording your data and discovering what processes were launched, please disable command line auditing which will stop tracking when processes are created. And just to be sure that tracking is fully disabled, be sure to reboot your PC. Your computer will then run just the same as before.
We hope you find this guide useful if you ever need to track down what command-line processes are running on your machine.


Awesome! You saved my day! Thank you!