
As the last part of the series of working with big data analytics solutions in Kubernetes, we learned about how to work with cloud-native applications with BDC. Operating and testing are also essential parts as an enterprise-grade solution.
This article will walk you through how to run and monitoring apps to SQL Server Big Data Clusters (BDC).
Run and test the application
To run and test the application that we deployed just now, we need to use azdata app run command, behind the scenes after you log in with azdata login command, you get a JWT token which automatically adds to authorization header, when you use app run command, the traffic went through application proxy which is an endpoint for managing applications deployed inside the big data cluster, and it authenticates users and then routes the requests through to the applications. By assuming your name of the app is called hello-python and we set the current version is v1, followed by the mandatory input message of your choice, you can use the following command to test out your application:
azdata app run --name hello-python --version v1 --inputs msg=hellobdc
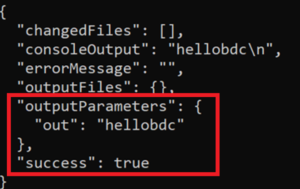
From the outputParameters which print out the result of the application and the value of success is true which means you have executed the application without any runtime exceptions.
Consume the application programmatically
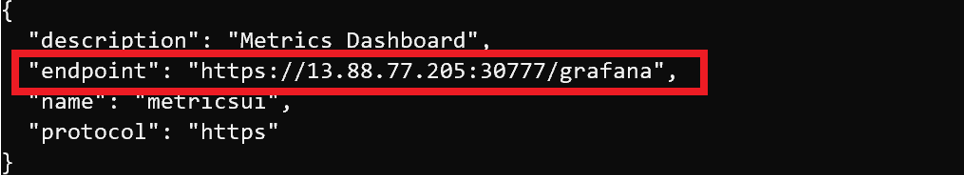
BDC provides endpoints that you can access and consume that application using a RESTful web service, the main purpose is to facilities the interaction with other web or mobile applications and being more proactive for those microservices or Marco service architecture. To get the endpoint of your application and for swagger.json, you can use azdata app describe command:
azdata app describe --name hello-python --version v1
The screen returned by this command will look like the following:
If you want to know more about how to consume the application with Swagger and Postman , you can check here to get more details.
Monitoring the application
Grafana is one of the best cloud-native virtualization tools which can be used to provide various monitoring metrics of your application running in Kubernetes. You can use the following command which will give you the endpoint of Grafana Dashboard.
azdata bdc endpoint list --endpoint-name metricsui
The output will give you the endpoint which you can use your cluster username and password to log in.
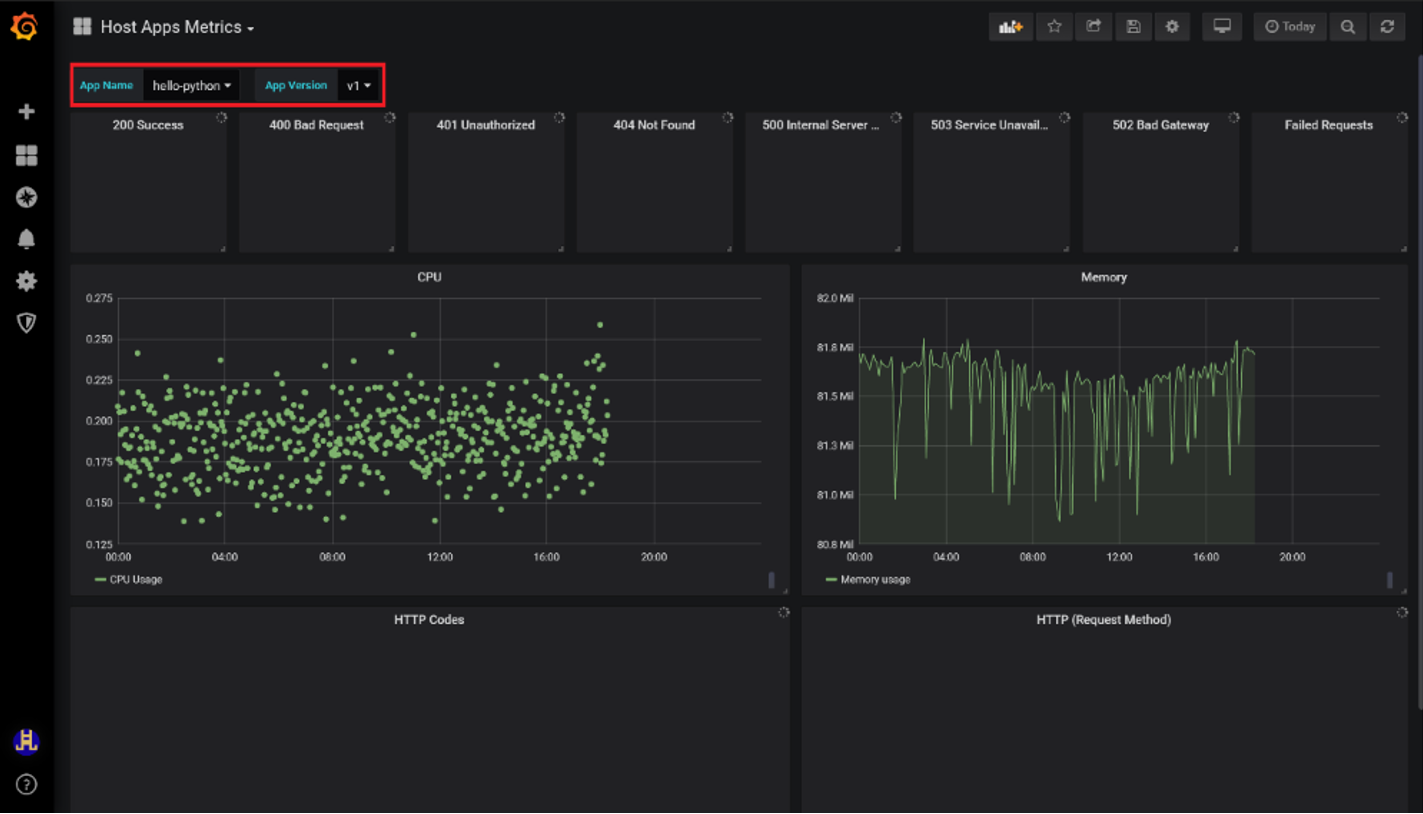
When you open the dashboard, go to the Host Apps Metrics, where you’ll get more insights about your application and keep in track.
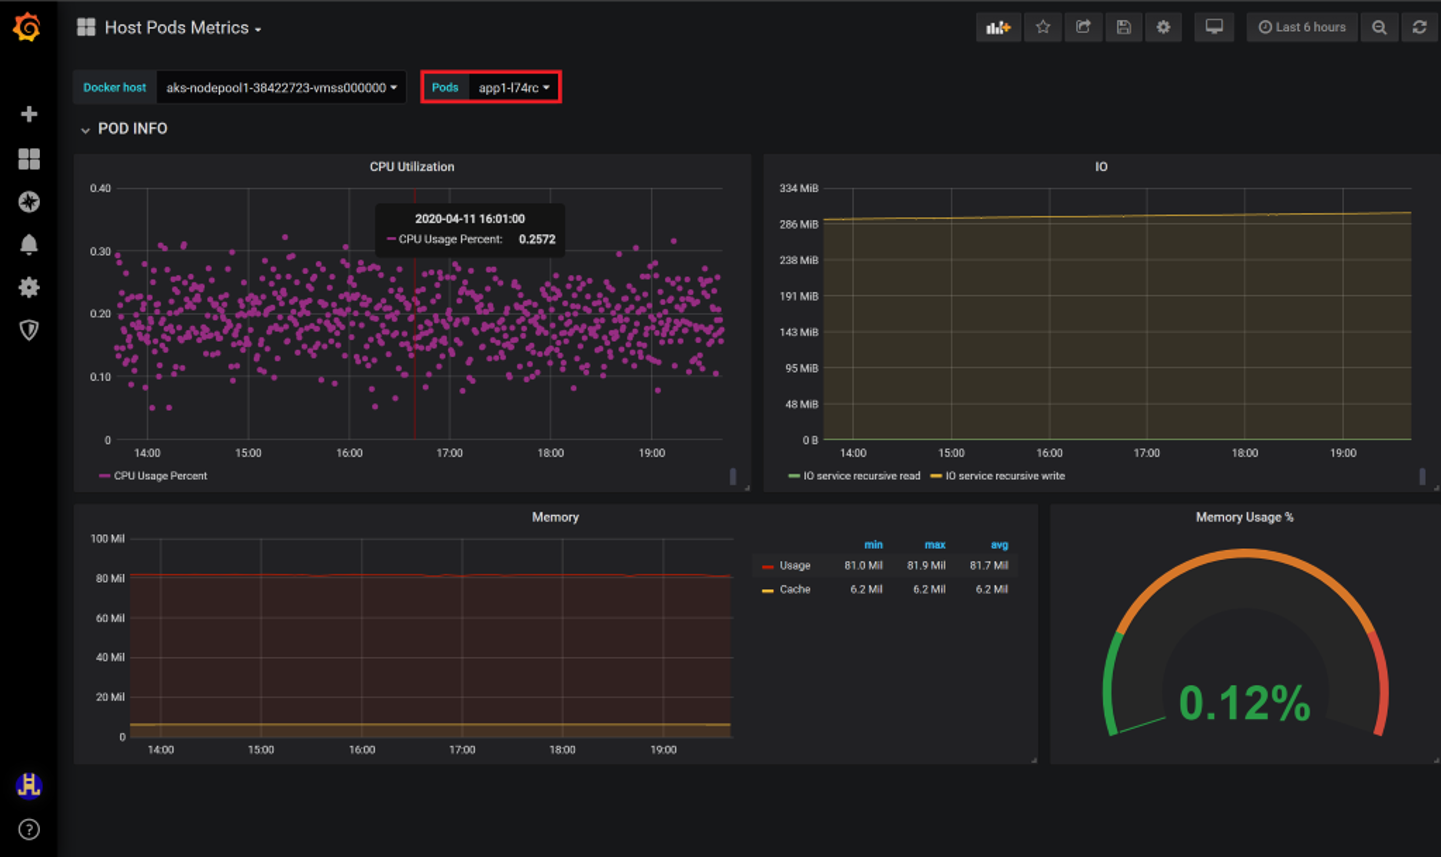
If you want to get more insight about a single pod of the application ( in case you have multiple copies of your application), you can also go to the Host Pods Metrics and choose the pod respectively, you’ll get a view of metrics as the following:
Next Steps
Everyone’s embracing DevOps nowadays, at Microsoft, we believe it brings people, processes, and technology together so everyone can focus on delivering value in their job. We talk about the end-to-end walkthrough in this article, we can take a step further to talk about more in-depth about how to deploy enterprise-grade applications with Microsoft DevOps tools such as Azure DevOps ( ADO ) or GitHub Actions as well as how to integrate them with enterprise-grade DevOps process and The Team Data Science Process (TDSP). Let’s stay tuned!
hi..very helpfull
پیلاچی