
Metrics Advisor Service Introduction
Metrics Advisor is an Azure Cognitive Service that uses AI to perform data monitoring and anomaly detection on timeseries data. The service automates the process of applying models to your data, and provides a set of APIs and web-based workspace for data ingestion, anomaly detection, and diagnostics – without needing to know machine learning.
We can use Metrics Advisor to:
- Analyze multi-dimensional data from multiple data sources
- Identify and correlate anomalies
- Configure and fine-tune the anomaly detection model used on your data
- Diagnose anomalies and help with root cause analysis
Basic Concepts
To get started, you must onboard your data from one of the supported data source types and configure the data feed settings. See the “How-to: Onboard your metric data to Metrics Advisor” article for detailed instructions on how to configure your data. As data is ingested, you can fine-tune the anomaly detection to fit your scenario and subscribe to alerts with notification hooks that will let you know of any anomalies detected. Moving forward, the service will provide diagnostic insights including root cause analysis and recommended actions while additionally using your feedback to perform automatic model customization and earlier notice of future anomalies.
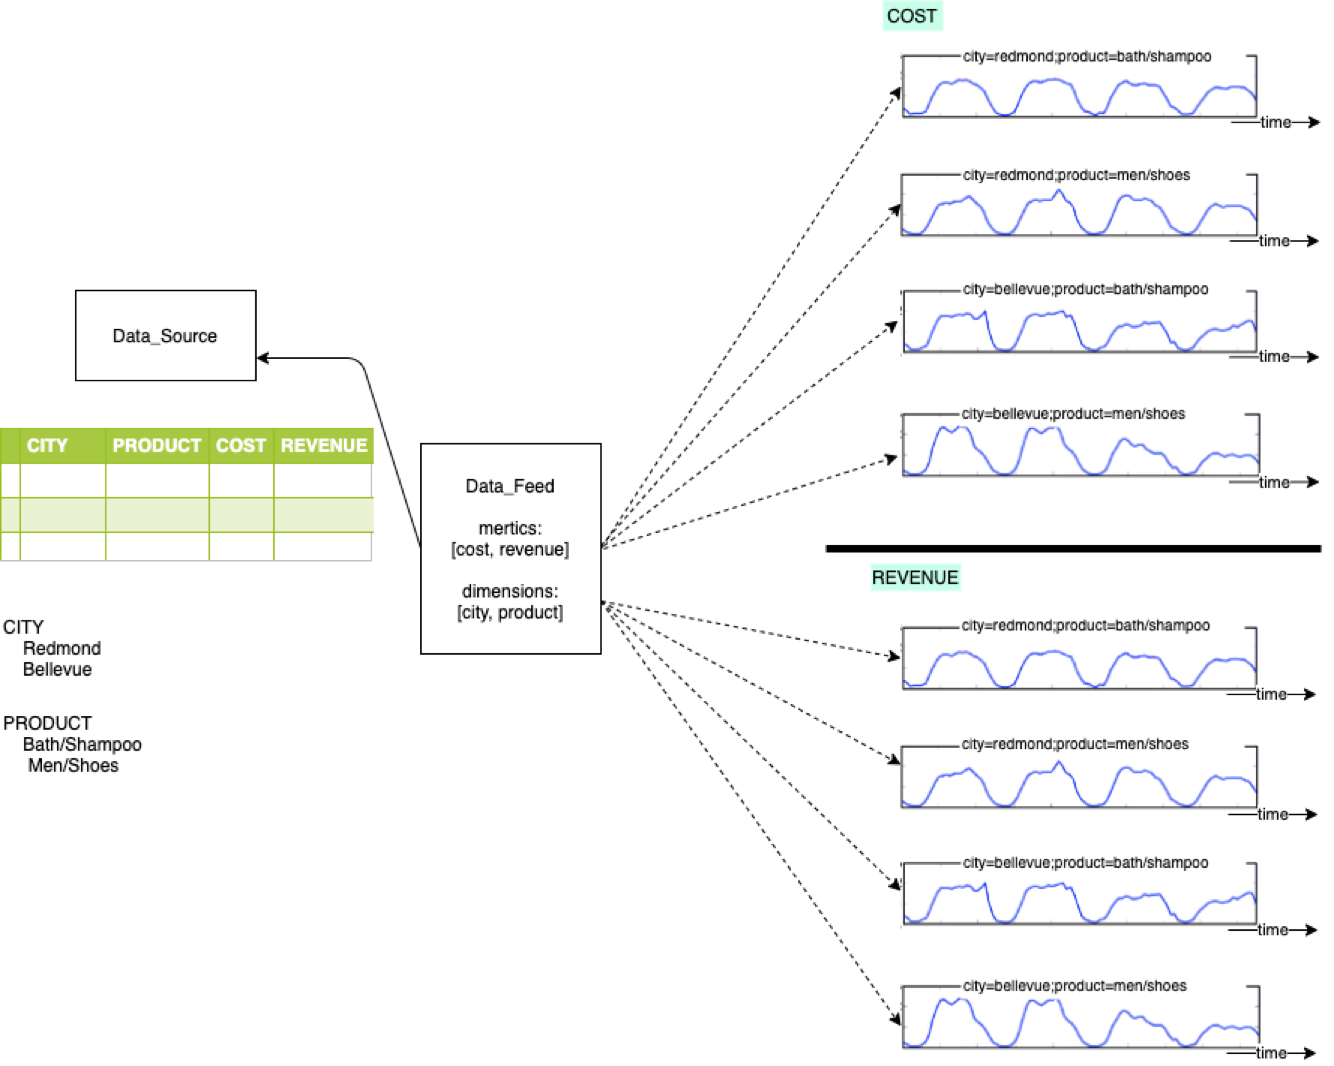
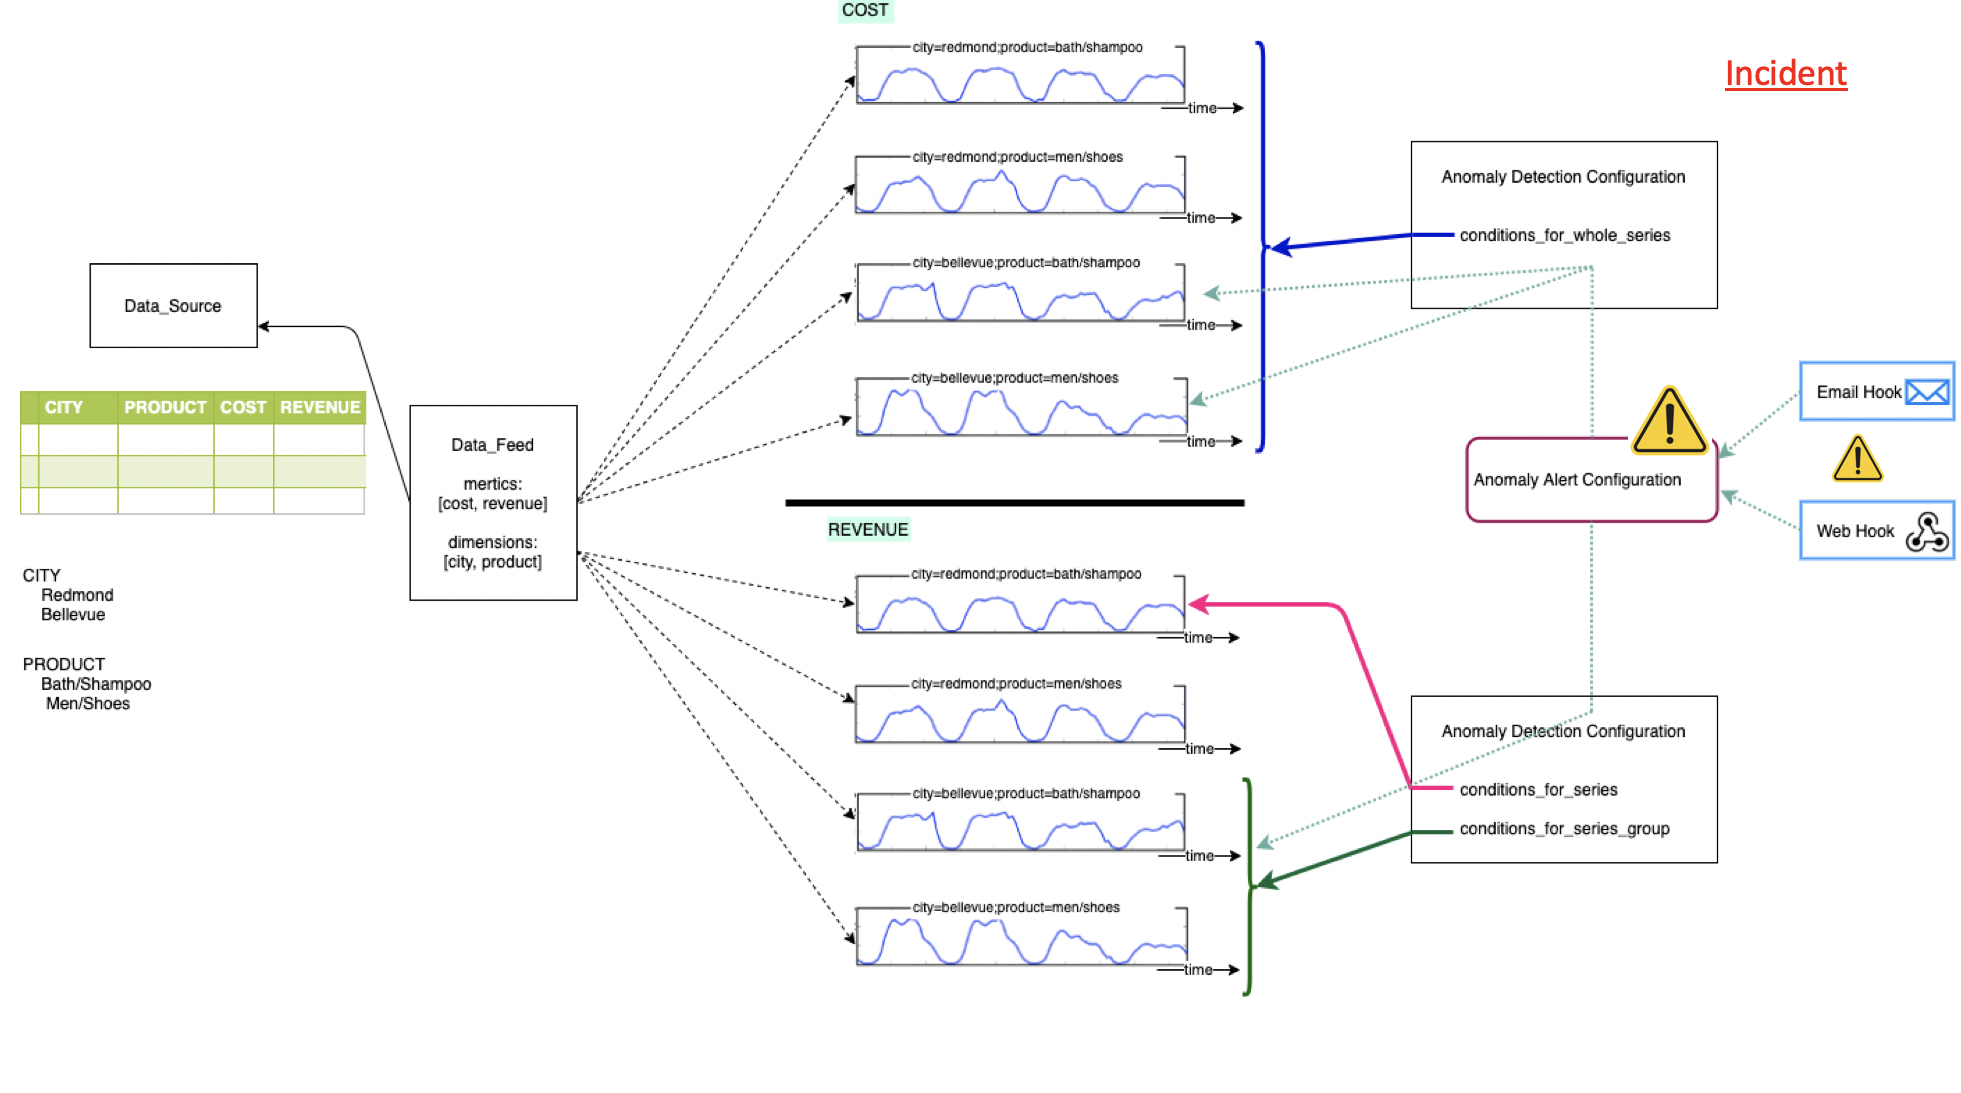
Metric, Dimensions, and Timeseries
The service can connect to various data sources. Consumers specify the metrics in the data-source that they want service to monitor and the dimensions of the metric. Service produces timeseries data for each metric across dimensions.
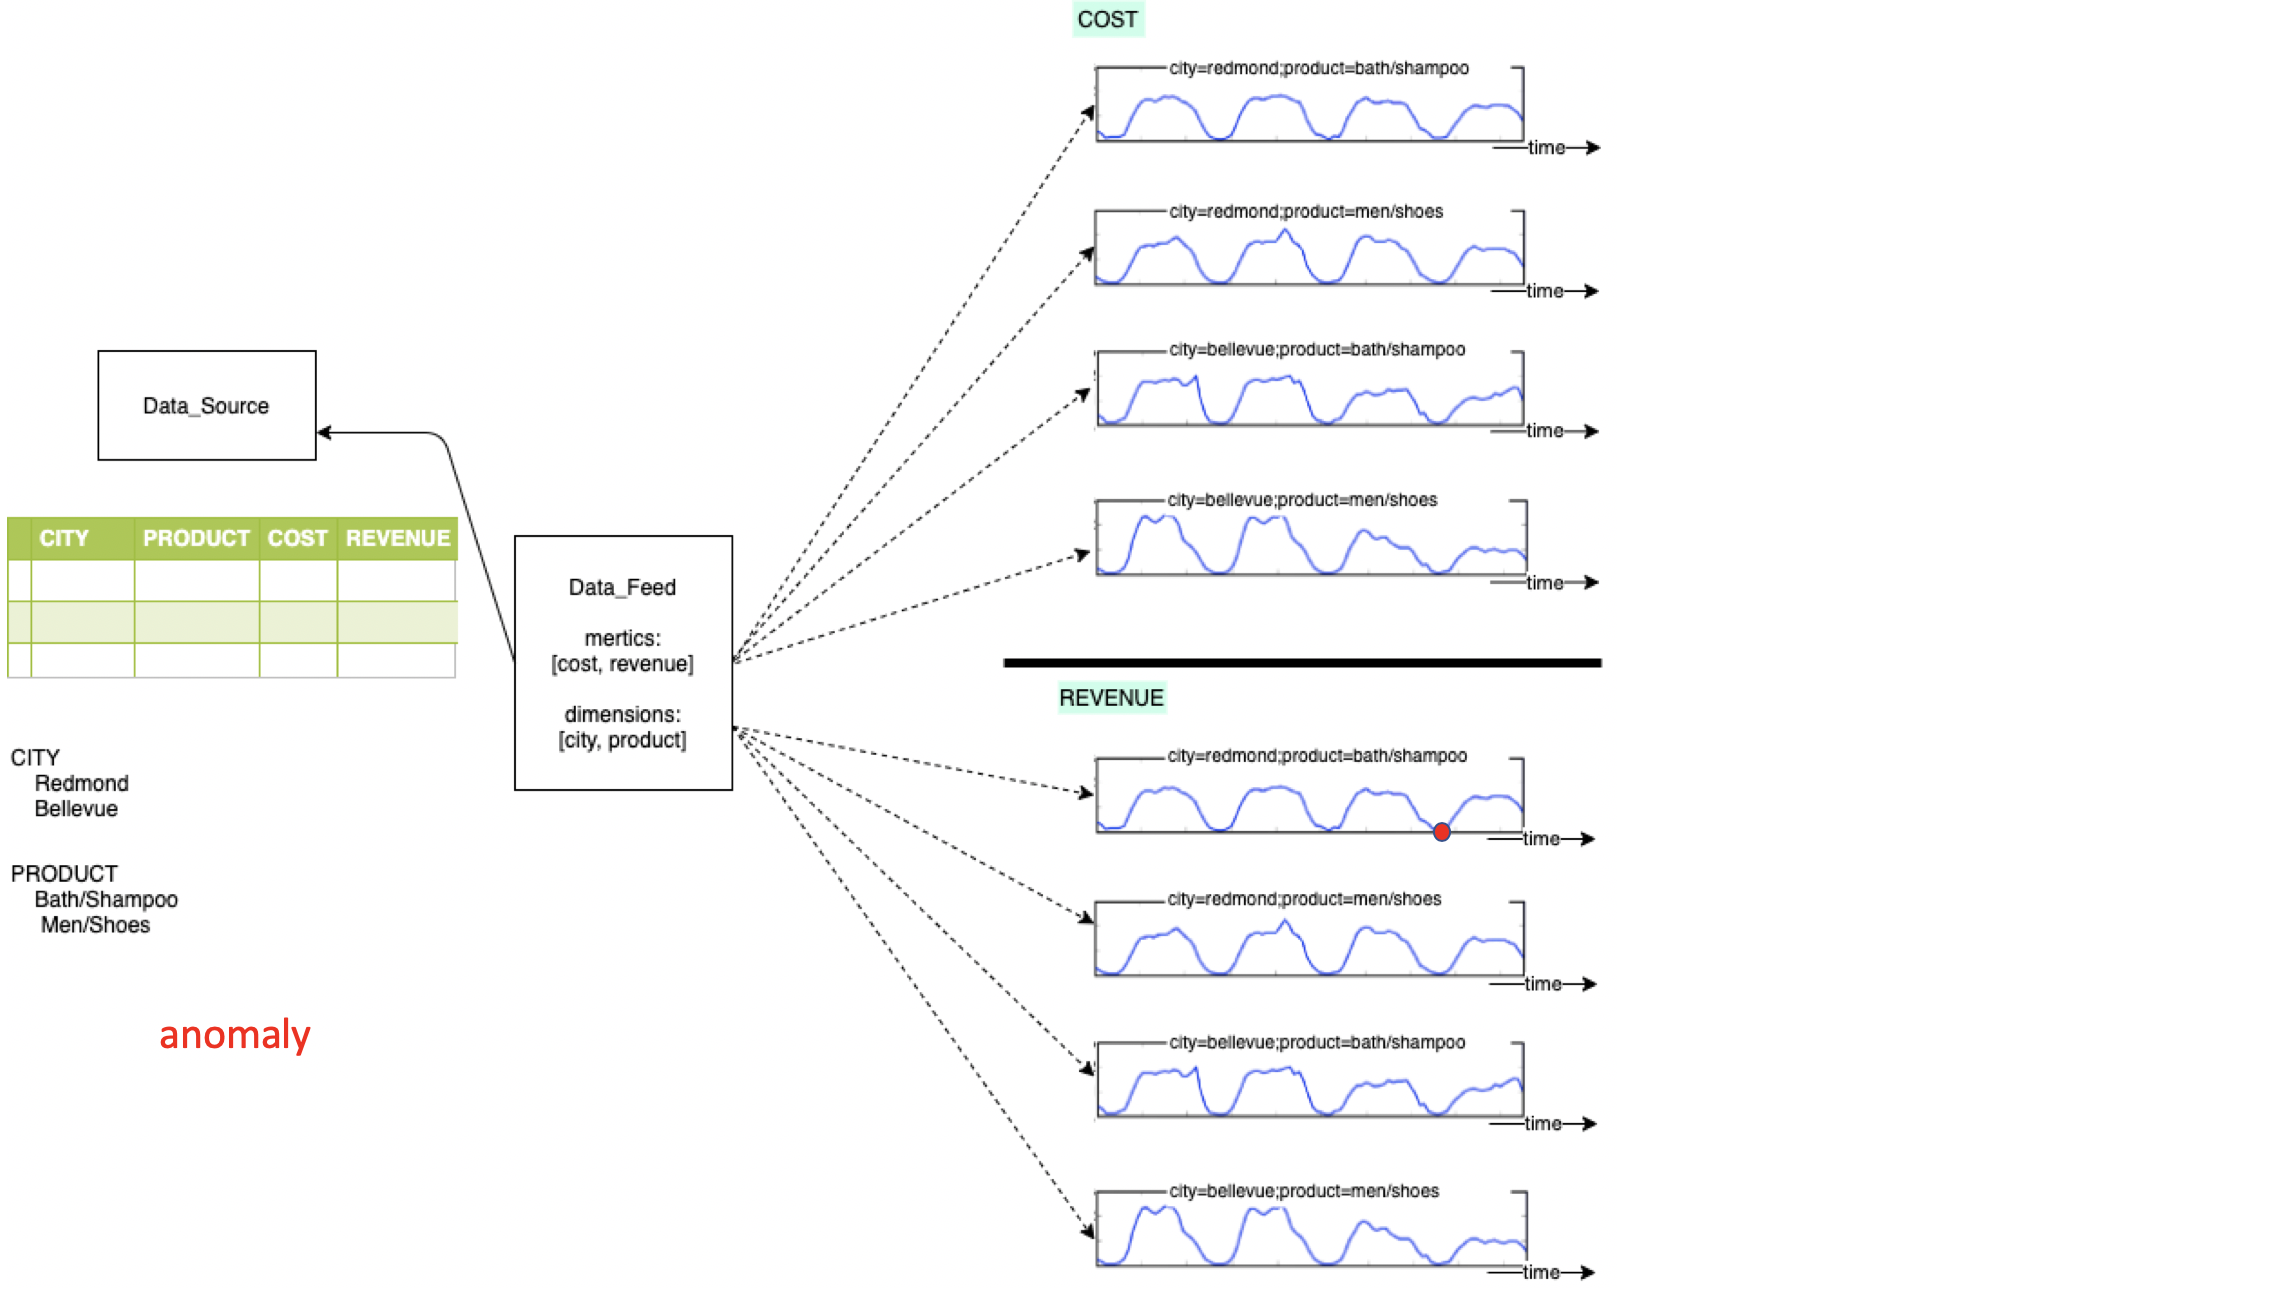
Anomaly
An anomaly is an abnormal data point in the timeseries.
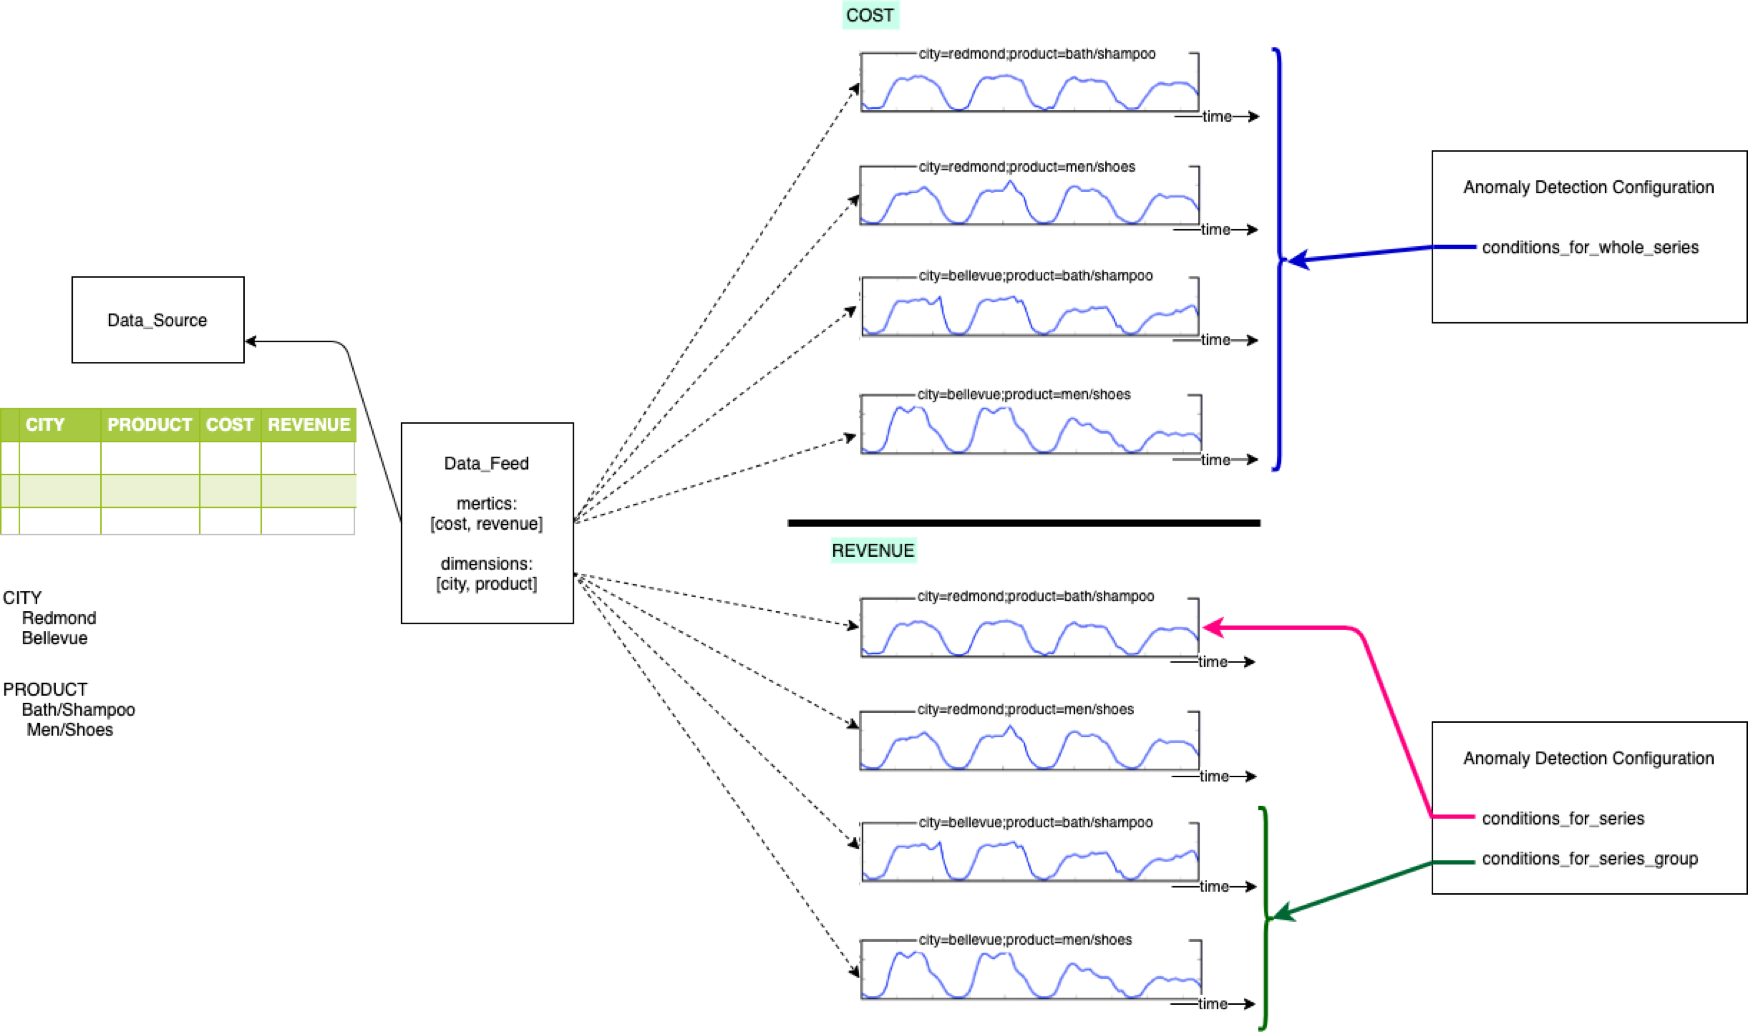
Anomaly Detection
Consumers can specify the anomaly detection configurations for the metric and timeseries, which will be used to detect the abnormal data point (i.e. anomalies).
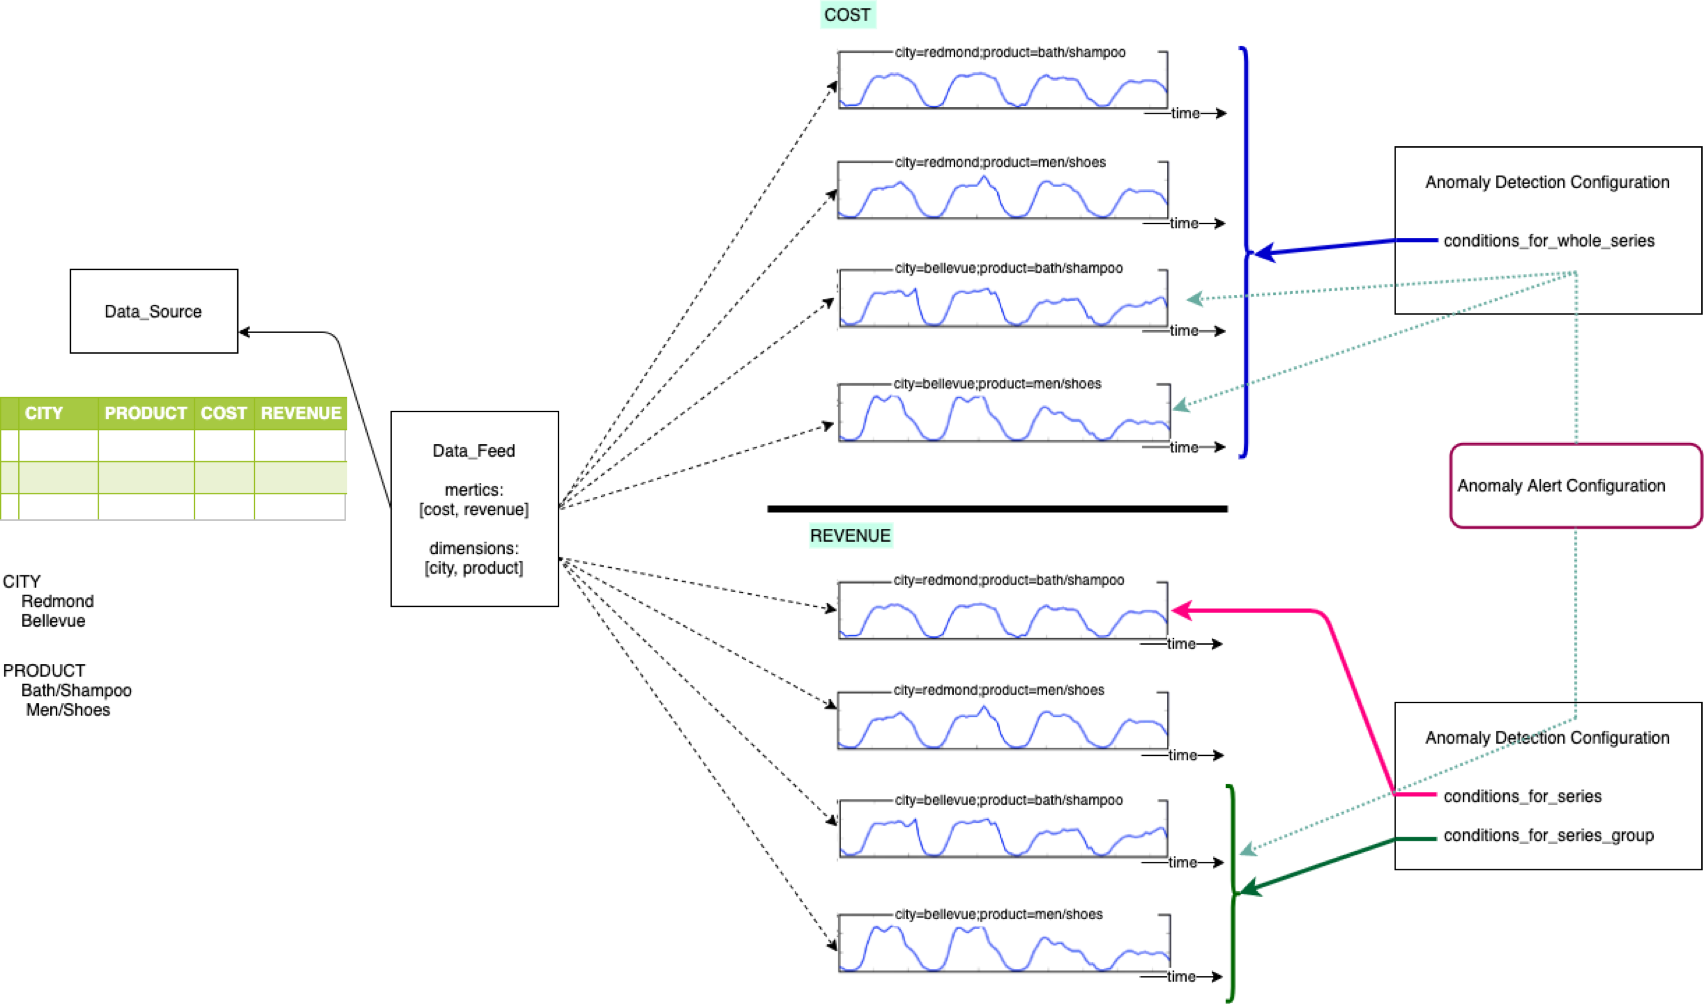
Alert
The alert configuration can be used to combine multiple anomaly detection configurations and produce alerts.
Incident
When anomalies appear for a long period of time or show some pattern, then service treats it as an incident. An alerting configuration can have notification hooks attached to it and an alert will be sent to the hook. Currently the supported hooks are – email and webhook.
Get the package
Today we want to demonstrate how to use the Python Metrics Advisor client library to configure the Metrics Advisor service, monitor anomalies, and handle incidents.
Run the following command to install the library:
pip install azure-ai-metricsadvisor --pre
We also support other languages including .NET, JavaScript/TypeScript, and Java.
Configure Metrics Advisor Service
To configure Metrics Advisor service, we need an authorized MetricsAdvisorAdministrationClient which needs two keys: – The subscription key to your Metrics Advisor resource. You can find this in the Keys and Endpoint section of your resource in the Azure portal. – The API key for your Metrics Advisor instance. You can find this in the workspace for Metrics Advisor, in API keys on the left navigation menu.
Then you can use the keys to create a client:
from azure.ai.metricsadvisor import (
    MetricsAdvisorKeyCredential,
    MetricsAdvisorAdministrationClient,
)
client = MetricsAdvisorAdministrationClient (<service_endpoint>,
        MetricsAdvisorKeyCredential(<subscription_key>, <api_key>))
Now let’s get our data onboarded. Metrics Advisor supports connecting different types of data sources. In this demo, we will use the data from SQL Server.
import datetime
from azure.ai.metricsadvisor.models import (
        SQLServerDataFeed,
        DataFeedSchema,
        Metric,
        Dimension,
        DataFeedOptions,
        DataFeedRollupSettings,
        DataFeedMissingDataPointFillSettings
    )

data_feed = client.create_data_feed(
    name="My data feed",
    source=SQLServerDataFeed(
        connection_string=<sql_server_connection_string>,
        query=<query>,
    ),
    granularity="Daily",
    schema=DataFeedSchema(
        metrics=[
            Metric(name="cost", display_name="Cost"),
            Metric(name="revenue", display_name="Revenue")
        ],
        dimensions=[
            Dimension(name="category", display_name="Category"),
            Dimension(name="city", display_name="City")
        ],
        timestamp_column="Timestamp"
    ),
    ingestion_settings=datetime.datetime(2019, 10, 1),
    options=DataFeedOptions(
        data_feed_description="cost/revenue data feed",
        rollup_settings=DataFeedRollupSettings(
            rollup_type="AutoRollup",
            rollup_method="Sum",
            rollup_identification_value="__SUM__"
        ),
        missing_data_point_fill_settings=DataFeedMissingDataPointFillSettings(
            fill_type="SmartFilling"
        ),
        access_mode="Private"
    )
)
Here we set rollup_type to “AutoRollup” and rollup_method to “Sum” so the service will automatically use “Sum” method to calculate the aggregations for the ingested data.
After the data is ingested, a default detection configuration is automatically applied to each metric. Now, we want to configure an AnomalyAlertConfiguration to tell the service in which conditions an alert needs to be triggered.
from azure.ai.metricsadvisor.models import (
    MetricAlertConfiguration,
    MetricAnomalyAlertScope,
    TopNGroupScope,
    MetricAnomalyAlertConditions,
    SeverityCondition,
    MetricBoundaryCondition,
    MetricAnomalyAlertSnoozeCondition
)

alert_config = client.create_anomaly_alert_configuration(
    name="my alert config",
    description="alert config description",
    cross_metrics_operator="AND",
    metric_alert_configurations=[
        MetricAlertConfiguration(
            detection_configuration_id=<anomaly_detection_configuration_id>,
            alert_scope=MetricAnomalyAlertScope(
                scope_type="WholeSeries"
            ),
            alert_conditions=MetricAnomalyAlertConditions(
                severity_condition=SeverityCondition(
                    min_alert_severity="Low",
                    max_alert_severity="High"
                )
            )
        ),
        MetricAlertConfiguration(
            detection_configuration_id=<anomaly_detection_configuration_id>,
            alert_scope=MetricAnomalyAlertScope(
                scope_type="TopN",
                top_n_group_in_scope=TopNGroupScope(
                    top=10,
                    period=5,
                    min_top_count=5
                )
            ),
            alert_conditions=MetricAnomalyAlertConditions(
                metric_boundary_condition=MetricBoundaryCondition(
                    direction="Up",
                    upper=50
                )
            ),
            alert_snooze_condition=MetricAnomalyAlertSnoozeCondition(
                auto_snooze=2,
                snooze_scope="Metric",
                only_for_successive=True
            )
        ),
    ],
    hook_ids=[<hook_id>]
)
Query anomalies and alerts
After the configurations are set, Metrics Advisor service will keep running and monitoring anomalies for us. If we assign hooks when creating AnomalyAlertConfiguration, callbacks will be invoked when alerts pop up. Of course, we can use MetricsAdvisorClient to query anomalies and alerts as well.
import datetime
from azure.ai.metricsadvisor import (
    MetricsAdvisorKeyCredential,
    MetricsAdvisorClient,
)
client = MetricsAdvisorClient(<service_endpoint>,
        MetricsAdvisorKeyCredential(<subscription_key>, <api_key>))

results = client.list_alerts_for_alert_configuration(
    alert_configuration_id=<alert_config_id>,
    start_time=datetime.datetime(2020, 1, 1),
    end_time=datetime.datetime(2020, 9, 9),
    time_mode="AnomalyTime",
)
print("Alerts")
for result in results:
    print("    Alert id: {}".format(result.id))
    print("    Created on: {}".format(result.created_on))

results = client.list_anomalies_for_alert(
    alert_configuration_id=<alert_config_id>,
    alert_id=<alert_id>,
)
print("Anomalies")
for result in results:
    print("    Detection configuration id: {}".format(result.detection_configuration_id))
    print("    Severity: {}".format(result.severity))
    print("    Status: {}".format(result.status))
Output:
Alerts
    Created on: 2020-09-12 01:15:16.406000+00:00
    Alert id: 17465dcc000
    Created on: 2020-09-12 01:14:17.184000+00:00
    Alert id: 17460b66400

Anomalies
    Detection configuration id: xxxxxxxx-xxxx-xxxx-xxxx-xxxxxxxxxxxx
    Severity: Low
    Status: Active
You are all set! Azure Metrics Advisor service will monitor your timeseries and trigger alerts when something is wrong. Enjoy!
Further Documentation
- Metrics Advisor documentation
- Python Reference Documentation, Readme
- .NET Reference Documentation, Readme
- JavaScript/TypeScript Reference Documentation, Readme
- Java Reference Documentation, Readme
Azure SDK Blog Contributions
Thank you for reading this Azure SDK blog post! We hope that you learned something new and welcome you to share this post. We are open to Azure SDK blog contributions. Please contact us at azsdkblog@microsoft.com with your topic and we’ll get you setup as a guest blogger.
Azure SDK Links
- Azure SDK Website: aka.ms/azsdk
- Azure SDK Intro (3 minute video): aka.ms/azsdk/intro
- Azure SDK Intro Deck (PowerPoint deck): aka.ms/azsdk/intro/deck
- Azure SDK Releases: aka.ms/azsdk/releases
- Azure SDK Blog: aka.ms/azsdk/blog
- Azure SDK Twitter: twitter.com/AzureSDK
- Azure SDK Design Guidelines: aka.ms/azsdk/guide
- Azure SDKs & Tools: azure.microsoft.com/downloads
- Azure SDK Central Repository: github.com/azure/azure-sdk
- Azure SDK for .NET: github.com/azure/azure-sdk-for-net
- Azure SDK for Java: github.com/azure/azure-sdk-for-java
- Azure SDK for Python: github.com/azure/azure-sdk-for-python
- Azure SDK for JavaScript/TypeScript: github.com/azure/azure-sdk-for-js
- Azure SDK for Android: github.com/Azure/azure-sdk-for-android
- Azure SDK for iOS: github.com/Azure/azure-sdk-for-ios
- Azure SDK for Go: github.com/Azure/azure-sdk-for-go
- Azure SDK for C: github.com/Azure/azure-sdk-for-c
- Azure SDK for C++: github.com/Azure/azure-sdk-for-cpp
0 comments