
Todays topic is diagnostics with Python applications. I have a fairly complex application, and something is going wrong. Azure provides a capability within Azure Monitor called transaction monitoring that tracks a transaction (such as an API call) from your application all the way through to the service that fulfills the request. This is powered by OpenTelemetry, a distributed tracing framework.
As always, when learning a new technology, I simplify the application so I can see what is going on. Here is a really simple application:
import os
from azure.identity import DefaultAzureCredential
from azure.core.exceptions import ResourceExistsError
from azure.storage.blob import BlobServiceClient

def upload_to(account_url, container_name, blob_name):
  # Create a client for this request
  client = BlobServiceClient(account_url, credential=DefaultAzureCredential())

  # Create a client for the named container
  container_client = client.get_container_client(container_name)
  try:
    container_client.create_container()
    print("Container created")
  except ResourceExistsError:
    print("Container already exists (ignored).")

  # Create a client for the named blob and upload data
  blob_client = container_client.get_blob_client(blob_name)
  with open(blob_name, "rb") as data:
    blob_client.upload_blob(data, overwrite=True)

# Upload main.py to the container
storage_url=os.environ["APP_STORAGE_ACCOUNT_URL"]
upload_to(storage_url, "demo", "main.py")
This simple console application creates a container within the storage account, then uploads the main.py file (which contains the source code to the app) as a blob. To support this, I’ve created a resource group, a storage account, and a service principal with permissions to access the storage account using the Azure CLI.
az group create \
  --name python-demoapp \
  --location westus
az storage account create \
  --name pythondemoapp03242020 \
  --resource-group python-demoapp \
  --location westus \
  --sku Standard_LRS \
  --kind StorageV2
az ad sp create-for-rbac \
  --name http://pythondemoapp03242020 \
  --role "Storage Blob Data Contributor" \
  --scopes /subscriptions/<SUBSCRIPTION>/resourceGroups/python-demoapp
The storage account name must be unique across Azure, so pick a good name! Replace SUBSCRIPTION with your Subscription ID. You can use the az account show command to see the subscription. You can then set some environment variables based on the output:
export AZURE_TENANT_ID="<create-for-rbac output tenant>"
export AZURE_CLIENT_ID="<create-for-rbac output appId>"
export AZURE_CLIENT_SECRET="<create-for-rbac output password>"
export APP_STORAGE_ACCOUNT_URL="<storage-create output primaryEndpoints.blob>"
When you run the application, you will likely see a one liner output that shows that the container is created or not. If there is an error, it will be displayed because of exception handling. However, you probably won’t know where the application is breaking. There is a more insidious error, though. What happens if the container create call takes a long time? How would you know it was that call and not the upload, or some of your other logic, for example?
Basic logging
The Azure SDK for Python uses Python logging:
import logging

logging.basicConfig()
azure_root_logger = logging.getLogger('azure')
azure_root_logger.setLevel(logging.DEBUG)
This will print the request and response. Information that may have PII is redacted, but otherwise you get all the headers along with the request and response. This allows you to see if the SDK is doing the right thing, and it will also allow you to assure yourself that your code is handling the responses correctly, especially when augmented by logging of your own.
Distributed tracing
When you are looking at why a particular network operation is slow, logging alone won’t help you. You need to be able to trace the entire request from beginning to end, including “across the wire” to the service. Consider a typical application has the application, a piece of middleware that implements a REST or GraphQL endpoint, and then a database connection. Which bit of the infrastructure is slow gets really complicated. As the infrastructure becomes more complex, so does the difficulty of figuring out which piece of the infrastructure is having issues.
Enter OpenTelemetry. OpenTelemetry is an open standard that allows you to trace requests across your infrastructure. It passes headers between the various components to move the request ID through the system. Let’s start by instrumenting the application.
The OpenTelemetry library is in preview right now, and the API is changing with new versions. Ensure you are using an API/SDK version that is compatible with your exporter and plugins. Before you use preview packages, create and activate a virtual environment for your work.
First, we need some libraries:
pip install opentelemetry-api==0.4a0
pip install opentelemetry-sdk==0.4a0
NOTE We are pinning the version of the OpenTelemetry SDK here so that the instructions work properly. The API for OpenTelemetry is changing, so make sure you follow the appropriate instructions. You can find the documentation for this version on GitHub.
Then, let’s update the app to support basic tracing:
import os
from azure.identity import DefaultAzureCredential
from azure.core.exceptions import ResourceExistsError
from azure.storage.blob import BlobServiceClient
from opentelemetry import trace
from opentelemetry.sdk.trace import TracerSource
from opentelemetry.sdk.trace.export import SimpleExportSpanProcessor

# Configure OpenTelemetry Exporter
from opentelemetry.sdk.trace.export import ConsoleSpanExporter
exporter = ConsoleSpanExporter()

# Configure OpenTelemetry Tracing
trace.set_preferred_tracer_source_implementation(lambda T: TracerSource())
trace.tracer_source().add_span_processor(
    SimpleExportSpanProcessor(exporter)
)
tracer = trace.get_tracer(__name__)

def upload_to(account_url, container_name, blob_name):
  with tracer.start_as_current_span("upload_to"):
    # Create a client for this request
    client = BlobServiceClient(account_url, credential=DefaultAzureCredential())

    # Create a client for the named container
    container_client = client.get_container_client(container_name)
    try:
      container_client.create_container()
      print("Container created")
    except ResourceExistsError:
      print("Container already exists (ignored).")

    # Create a client for the named blob
    blob_client = container_client.get_blob_client(blob_name)
    with open(blob_name, "rb") as data:
      blob_client.upload_blob(data, overwrite=True)

# Upload main.py to the container
with tracer.start_as_current_span("mainapp"):
  storage_url=os.environ['APP_STORAGE_ACCOUNT_URL']
  upload_to(storage_url, "demo", "main.py")
First, you need to decide where you are going to put the trace information you collect. This is known as an Exporter. There are several good ones (and we’ll get onto that in a moment), but, for now, we are just sending the trace information to the console. We can then configure the rest of the OpenTelemetry system.
Once you have the OpenTelemetry library configured, just wrap each of the blocks you want to group together with a with tracer.start_as_current_span(name). This creates a unique Span – a block of operations with a start and an end that you can time individually. I’ve got one span for the main application, and another (inner) span for the upload_to method.
Running the app, this is what the output looks like:
$ python main.py
Container already exists (ignored).
Span(
  name="upload_to",
  context=SpanContext(trace_id=0x55dfc91e9feb3a56df74d9add43038f2,
   span_id=0x8dab600f714bfb13, trace_state={}
  ),
  kind=SpanKind.INTERNAL,
  parent=Span(name="mainapp",
    context=SpanContext(trace_id=0x55dfc91e9feb3a56df74d9add43038f2,
      span_id=0xb2a773d445c6237b, trace_state={}
    )
  ),
  start_time=2020-03-19T21:40:29.285159Z,
  end_time=2020-03-19T21:40:30.060733Z)
Span(
  name="mainapp",
  context=SpanContext(trace_id=0x55dfc91e9feb3a56df74d9add43038f2,
    span_id=0xb2a773d445c6237b, trace_state={}
  ),
  kind=SpanKind.INTERNAL,
  parent=None,
  start_time=2020-03-19T21:40:29.285159Z,
  end_time=2020-03-19T21:40:30.061730Z
)
I’ve formatted the output to make it more readable. You can see two spans – one inside the other – with the appropriate names.
Enable distributed tracing in the Azure SDK
To enable distributed tracing within the Azure SDK, you need to tell Azure Core which tracing library you are using. There is a tracing implementation for the older OpenCensus and the newer OpenTelemetry. You could also write your own, although that would be more work. Install the preview tracing package for the Azure SDK:
pip install azure-core-tracing-opentelemetry
Then, add the following three lines to the start of your application:
# Configure distributed tracing in Azure SDK
from azure.core.settings import settings
from azure.core.tracing.ext.opentelemetry_span import OpenTelemetrySpan
settings.tracing_implementation = OpenTelemetrySpan
Run the app again to see the results:
Span(name="/xxxxxxxx-xxxx-xxxx-xxxx-xxxxxxxx/oauth2/v2.0/token", context=SpanContext(trace_id=0x48776c79e95d494e1b24353ba9046b29, span_id=0x2e3ee534daffef73, trace_state={}), kind=SpanKind.CLIENT, parent=Span(name="ContainerClient.create_container", context=SpanContext(trace_id=0x48776c79e95d494e1b24353ba9046b29, span_id=0x78c07183a6860ff7, trace_state={})), start_time=2020-03-19T21:43:33.383835Z, end_time=2020-03-19T21:43:33.725025Z)Span(name="/demo", context=SpanContext(trace_id=0x48776c79e95d494e1b24353ba9046b29, span_id=0x6c6e9f9ce09e3c03, trace_state={}), kind=SpanKind.CLIENT, parent=Span(name="ContainerClient.create_container", context=SpanContext(trace_id=0x48776c79e95d494e1b24353ba9046b29, span_id=0x78c07183a6860ff7, trace_state={})), start_time=2020-03-19T21:43:33.726025Z, end_time=2020-03-19T21:43:34.035472Z)Span(name="ContainerClient.create_container", context=SpanContext(trace_id=0x48776c79e95d494e1b24353ba9046b29, span_id=0x78c07183a6860ff7, trace_state={}), kind=SpanKind.INTERNAL, parent=Span(name="upload_to", context=SpanContext(trace_id=0x48776c79e95d494e1b24353ba9046b29, span_id=0x3e61cb726380e524, trace_state={})), start_time=2020-03-19T21:43:33.360182Z, end_time=2020-03-19T21:43:34.051102Z)Container already exists (ignored).
Span(name="/demo/main.py", context=SpanContext(trace_id=0x48776c79e95d494e1b24353ba9046b29, span_id=0x6d60987367993bab, trace_state={}), kind=SpanKind.CLIENT, parent=Span(name="BlobClient.upload_blob", context=SpanContext(trace_id=0x48776c79e95d494e1b24353ba9046b29, span_id=0x52f5313f59b27526, trace_state={})), start_time=2020-03-19T21:43:34.095871Z, end_time=2020-03-19T21:43:34.139872Z)Span(name="BlobClient.upload_blob", context=SpanContext(trace_id=0x48776c79e95d494e1b24353ba9046b29, span_id=0x52f5313f59b27526, trace_state={}), kind=SpanKind.INTERNAL, parent=Span(name="upload_to", context=SpanContext(trace_id=0x48776c79e95d494e1b24353ba9046b29, span_id=0x3e61cb726380e524, trace_state={})), start_time=2020-03-19T21:43:34.093871Z, end_time=2020-03-19T21:43:34.145869Z)Span(name="upload_to", context=SpanContext(trace_id=0x48776c79e95d494e1b24353ba9046b29, span_id=0x3e61cb726380e524, trace_state={}), kind=SpanKind.INTERNAL, parent=Span(name="mainapp", context=SpanContext(trace_id=0x48776c79e95d494e1b24353ba9046b29, span_id=0x1f1c8cafdd0189ea, trace_state={})), start_time=2020-03-19T21:43:33.328939Z, end_time=2020-03-19T21:43:34.145869Z)Span(name="mainapp", context=SpanContext(trace_id=0x48776c79e95d494e1b24353ba9046b29, span_id=0x1f1c8cafdd0189ea, trace_state={}), kind=SpanKind.INTERNAL, parent=None, start_time=2020-03-19T21:43:33.328939Z, end_time=2020-03-19T21:43:34.148870Z)
We got two lines of output. One of the lines is a forked trace purely for the authentication flow. The second one is for the main application.
Send the traces to Azure Monitor
Of course, you don’t always get to see the application when it is running. In fact, it’s rare that you can run an application on the console. Dumping the spans to the console is probably not the best idea. Visually, you can also use Zipkin or Jaeger to visualize the traces during development. For production apps, you want to integrate with Azure Monitor, which provides an integration point for your logs, metrics, alerts, and other production needs. First, create an Application Insights resource:
az extension add -n application-insights
az monitor app-insights component create \
  --app pythondemoapp03242020 \
  --location westus \
  --kind web \
  -g python-demoapp \
  --application-type web
This will output the instrumentation key, which you need to place in an environment variable:
$env:APPINSIGHTS_INSTRUMENTATION_KEY="<output instrumentationKey>"
Replace the exporter in your code with the following:
from azure_monitor import AzureMonitorSpanExporter
exporter = AzureMonitorSpanExporter(
  instrumentation_key = os.environ['APPINSIGHTS_INSTRUMENTATION_KEY']
)
Run your code. You can now view the application map, along with all the resources it connects to within Azure Monitor. The traces also show up in the dependencies logs, which allows them to be used in end-to-end transaction monitoring.
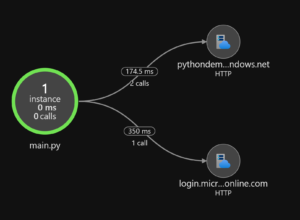
From this application map, you can see that two HTTP calls happened to the storage resource, and one call to the Azure AD resource. You can see the average time they took. From here, you can dive in deeper to performance problems in your application.
Want to hear more?
What do you think of distributed tracing? We’re actively soliciting your feedback on this feature, so let us know!
Follow us on Twitter at @AzureSDK. We’ll be covering more best practices in cloud-native development as well as providing updates on our progress in developing the next generation of Azure SDK.
0 comments