We’re always looking for ways to make developing with Visual Studio faster. One of the tasks developers do many times a day is launching debugging sessions. We identified that script debugging added about 1.5s per F5, but only about 15.5% of people actively debugged script using Visual Studio.
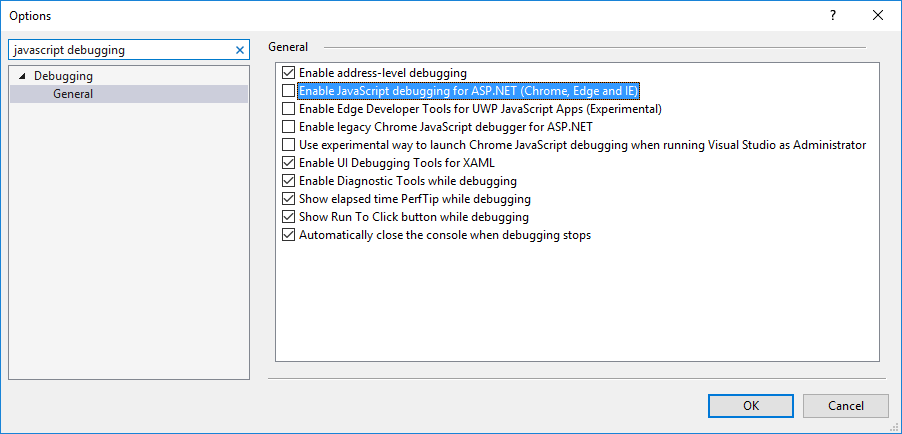
Based on the above, in Visual Studio 15.7 we made the decision to turn off script debugging by default to improve the overall experience for most users. If you want to turn the capability back on, you can do it from Tools | Options | Debugging | and check “Enable JavaScript debugging for ASP.NET (Chrome, Edge, and IE):
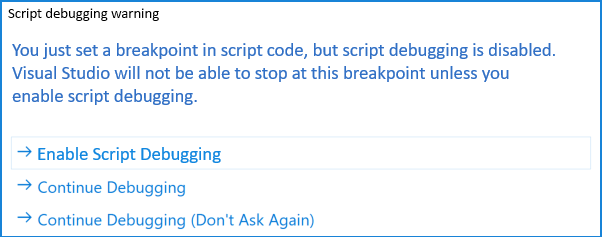
We also added the following dialog when you attempt to set a breakpoint with script debugging disabled:
When script debugging is ON, Visual Studio automatically stops debugging when the browser window is closed. It will also close the browser window if you stop debugging in Visual Studio. We added the same capability to Visual Studio when script debugging is OFF under Tools | Options | Project and Solutions | Web Projects:
With this option enabled:
- Visual Studio will open a new browser window when debugging starts
- Visual Studio will stop debugging when the browser window is closed
The following matrix shows you all the available options and the expected behavior for each combination:
| Enable JavaScript debugging for ASP.NET (Chrome, Edge and IE) | Stop debugger when browser window is closed | What happens when you start debugging | What happens when you stop debugging | What happens when you close the browser window |
| TRUE | TRUE | New browser window always pops up | New browser window always goes away, with all open tabs | Debugging stops |
| TRUE | FALSE | New browser window always pops up | New browser window always goes away, with all open tabs | Debugging stops |
| FALSE | TRUE | New browser window always pops up | New browser window always goes away, with all open tabs | Debugging stops |
| FALSE | FALSE | Opens new tab if browser window already exists | Browser tab/window stays open | Debugging continues |
If you want Visual Studio to return to its default pre-15.7 behavior, all you have to do is enable script debugging in Tools | Options | Debugging | and check “Enable JavaScript debugging for ASP.NET (Chrome, Edge, and IE). If you notice any unexpected behavior with these options please use report a problem in Visual Studio to let us know. If you have any feedback or suggestions regarding this change please let us know on uservoice or simply post a reply to this post.


0 comments