


Tips
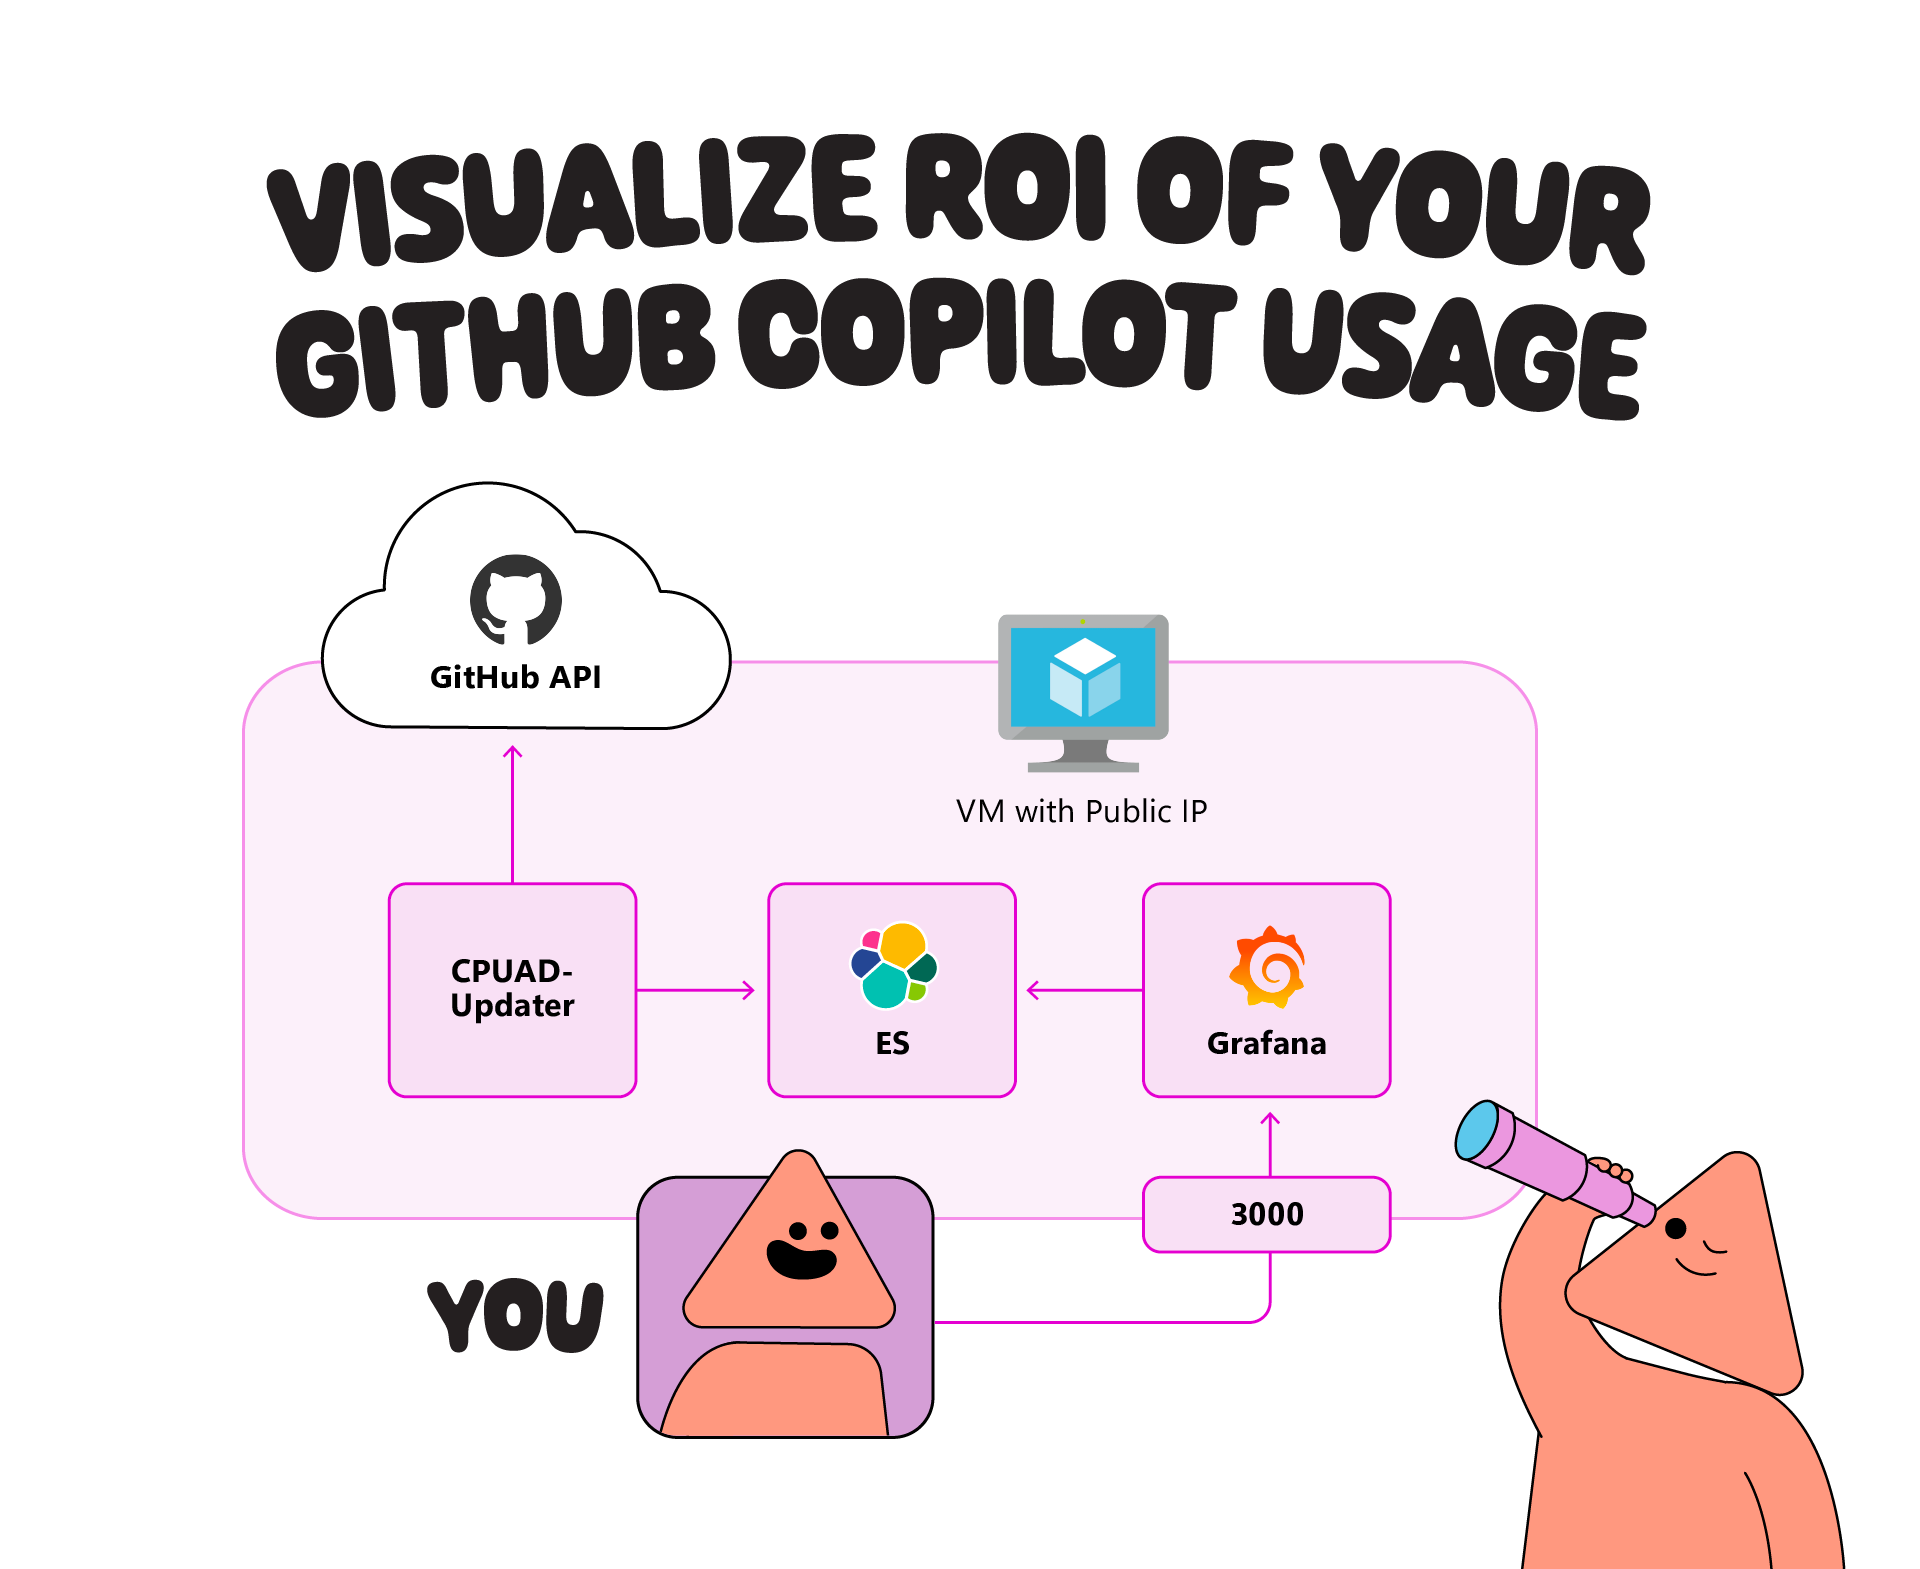
In today’s enterprise software development landscape, organizations are increasingly investing in AI-powered development tools like GitHub Copilot to boost developer productivity. However, the standard 28-day usage metrics often fall short of providing the comprehensive insights needed to truly understand ROI and adoption patterns across large organizations. The Copilot Usage Advanced Dashboard fills this critical gap by offering a powerful, enterprise-grade solution that captures and analyzes long-term usage data across multiple teams and organizations. Built with familiar tools like Elasticsearch and Grafana, this dashboard enables engineering leaders to track adoption trends, identify optimization opportunities, and quantify their Copilot investment’s impact through detailed breakdowns by language, editor, and team. Beyond just tracking lines of code, the dashboard provides insights into seat utilization, activation rates, and usage patterns that help organizations optimize their Copilot licenses and drive stronger developer adoption. For engineering teams evaluating or scaling their Copilot implementation, this tool provides the data-driven insights needed to make informed decisions about resource allocation and demonstrate clear business value to stakeholders.Architecture: How it works!
The Copilot Usage Advanced Dashboard offers a comprehensive suite of features designed to revolutionize how organizations track and analyze their Copilot usage. At its core, the solution leverages Elasticsearch for persistent data storage, breaking free from the traditional 28-day limitation and enabling analysis across extended time periods, from months to years. The system intelligently structures data with Organization and Team fields, facilitating granular filtering and cross-organizational insights. Data integrity is maintained through unique hash key generation for each data point, ensuring accurate and up-to-date information through automatic updates. The Grafana-based visualization layer offers complete flexibility, allowing teams to customize dashboards according to their specific needs and stakeholder requirements. Proactive usage monitoring is enabled through Grafana’s built-in alerting system, which can notify administrators about potential issues such as prolonged user inactivity. Furthermore, the platform’s open architecture supports seamless integration with third-party systems, whether for exporting data to external visualization platforms or incorporating additional data sources for comprehensive analytics, making it a truly versatile solution for enterprise-scale Copilot management. Copilot Usage Advanced Dashboard almost fully utilizes data from Copilot APIs, The APIs used are listed below representing Copilot usage in multi organizations and teams from different dimensions:
- List teams of an organization
- Get a summary of Copilot metrics for a team
- Get Copilot seat information and settings for an organization
- List all Copilot seat assignments for an organization
Data Collection
The system utilizes four key Copilot APIs to gather comprehensive usage data:
-
- Organization team listing
- Team usage summaries
- Organizational seat information and settings
- Seat assignment tracking
Key Features
1. Long-term Data Persistence
-
- Historical data stored in Elasticsearch beyond the 28-day limit
- Flexible time period selection for trend analysis
- Granular organizational and team-level data filtering
2. Advanced Analytics
-
- Language and editor usage breakdown
- Team performance comparisons
- Seat utilization metrics
- Activation rate tracking
- Custom alert configuration for inactive users
3. Integration Capabilities
-
- Seamless integration with existing Grafana deployments
- Export capabilities for third-party visualization tools
- Flexible data source additions for comprehensive DevOps metrics
Why Built This
This project aims to offer a more comprehensive and lasting view of GitHub Copilot usage beyond the default 28-day limit. Recognizing that many customers prefer proven tools like Grafana for monitoring and analysis, I set out to create a solution that integrates seamlessly into existing workflows without forcing users to learn new technologies. By storing and updating data over time, supporting multiple organizations and teams, and providing flexible options for external data integration, this project helps users gain deeper insights into both ROI of Copilot usage or and related DevOps metrics—such as DORA—within a unified dashboard if they want.Online Demo Environment
Two dashboards are designed, they both can exist at the same time in Grafana.
Copilot Usage Advanced Dashboard
Copilot Metrics Viewer compatible dashboard
If you are familiar with the copilot-metrics-viewer project, then please try this dashboard and use it in subsequent deployments.
-
- link: https://softrin.com/d/be7hpbvvhst8gc/copilot-usage-advanced-dashboard
- username:
demouser - password:
demouser

Copilot Usage Advanced Dashboard Original
New designed dashboard
-
- Link: https://softrin.com/d/a98455d6-b401-4a53-80ad-7af9f97be6f4/copilot-usage-advanced-dashboard-original
- username:
demouser - password:
demouser

Variables
Supports four filtering varibales, namely
- Organization
- Team
- Language
- Editor
The choice of variables is dynamically associated with the data display

Features
Copilot Usage Advanced Dashboard
1. Organization
First, based on List teams of an onganization, get all the teams under the Organization, and then based on Get a summary of Copilot usage for a team, sum and calculate the data of all teams under the Organization to get complete Organization-level data.
- Acceptance Rate Average =
sum(total_acceptances_count) / sum(total_suggestions_count) - Cumulative Number of Acceptence (Count) =
sum(total_acceptances_count) - Cumulative Number of Suggestions (Count) =
sum(total_suggestions_count) - Cumulative Number of Lines of Code Accepted =
sum(total_lines_accepted) - Acceptance Rate (%) =
total_acceptances_count / total_suggestions_count - Total Active Users =
total_active_users - Total Suggestions & Acceptances Count =
total_suggestions_count&total_acceptances_count - Total Lines Suggested & Accepted =
total_lines_suggested&total_lines_accepted

2. Teams
Based on the breakdown data in Get a summary of Copilot metrics for a team, the data is aggregated by Teams to obtain data comparisons of different Teams.
- Number of Teams =
unique_count(team_slug) - Top Teams by Accepted Prompts =
sum(acceptances_count).groupby(team_slug) - Top Teams by Acceptance Rate =
sum(acceptances_count).groupby(team_slug) / sum(suggestions_count).groupby(team_slug) - Team Breakdown =
sum(*).groupby(team_slug)

3. Languages
Based on the breakdown data in Get a summary of Copilot usage for a team, the data is aggregated according to Languages to obtain data comparisons for different Languages.
- Number of Languages=
unique_count(language) - Top Languages by Accepted Prompts =
sum(acceptances_count).groupby(language) - Top Languages by Acceptance Rate =
sum(acceptances_count).groupby(language) / sum(suggestions_count).groupby(language) - Languages Breakdown =
sum(*).groupby(language)

4. Editors
Based on the breakdown data in Get a summary of Copilot usage for a team, the data is aggregated by Editors to obtain data comparisons for different Editors.
- Number of Editors =
unique_count(editor) - Top Editors by Accepted Prompts =
sum(acceptances_count).groupby(editor) - Top Editors by Acceptance Rate =
sum(acceptances_count).groupby(editor) / sum(suggestions_count).groupby(editor) - Editors Breakdown =
sum(*).groupby(editor)

5. Copilot Chat
Based on the data from Get a summary of Copilot usage for a team, we can get the usage of Copilot Chat.
- Acceptance Rate Average =
sum(total_chat_acceptances) / sum(total_chat_turns) - Cumulative Number of Acceptances =
sum(total_chat_acceptances) - Cumulative Number of Turns =
sum(total_chat_turns) - Total Acceptances | Total Turns Count =
total_chat_acceptances|total_chat_turns - Total Active Copilot Chat Users =
total_active_chat_users

6. Seat Analysis
Based on the data analysis of Get Copilot seat information and settings for an organization and List all Copilot seat assignments for an organization, the seat allocation and usage are presented in a unified manner.
- Copilot Plan Type =
count(seats).groupby(plan_type) - Total =
seat_breakdown.total - Active in this Cycle =
seat_breakdown.active_this_cycle - Assigned But Never Used =
last_activity_at.isnan() - Inactive in this Cycle =
seat_breakdown.inactive_this_cycle - Ranking of Inactive Users ( ≥ 2 days ) =
today - last_activity_at - All assigned seats =
*

7. Breakdown Heatmap
Based on the breakdown data in Get a summary of Copilot usage for a team, we analyze the data from two dimensions: Languages and Editors. We can clearly see what combination of Languages and Editors can achieve the best Copilot usage effect.
- Active Users Count (Group by Language) =
active_users.groupby(language) - Accept Rate by Count (%) =
sum(acceptances_count).groupby(language) / sum(suggestions_count).groupby(language) - Accept Rate by Lines (%) =
sum(lines_accepted).groupby(language) / sum(lines_suggested).groupby(language) - Active Users Count (Group by Editor) =
active_users.groupby(editor) - Accept Rate by Count (%) =
sum(acceptances_count).groupby(editor) / sum(suggestions_count).groupby(editor) - Accept Rate by Lines (%) =
sum(lines_accepted).groupby(editor) / sum(lines_suggested).groupby(editor)

Copilot Usage Advanced Dashboard Original
1. Copilot Seat Info & Top Languages
- You can view the distribution of seats, Enterprise or Business? and overall activation trends. And for users who don’t use Copilot, they are ranked based on the length of inactivity and list users who have never activated.
- Ranking Language and Teams based on usage

2. Copilot Usage Total Insight
You can analyze the total number of recommendations and adoption rate trends based on Count Lines and Chats

3. Copilot Usage Breakdown Insight
You can analyze the effect of Copilot in different languages and different editor combinations.

How these metrics translate into ROI insights
Let me provide two concrete example scenarios that illustrate how these metrics can translate into ROI insights:
Scenario 1: Enterprise Software Company
- Initial situation: 200 developers at $100,000 annual salary each
- Observed metrics:
- 20% code acceptance rate
- More conservative time savings estimate: 0.4 hours per day
- Assuming 78% active usage remains constant
ROI calculation:
- Time savings: 0.4 hours × 200 developers = 80 hours daily
- Developer hourly cost: $100,000 ÷ 2080 working hours = ~$48/hour
- Daily productivity gain: 80 hours × $48 = $3,840
- Annual productivity gain: $998,400 (260 working days)
- Copilot cost: $19 × 200 developers × 12 months = $45,600 annually
- Net ROI: 2,089% ($998,400 gain – $45,600 cost = $952,800 benefit)
Scenario 2: Early-Stage Startup
- Initial situation: 12-person development team
- Observed metrics:
- 20% code acceptance rate
- 90% active user rate
- Adjusted time savings: 15% faster completion
ROI calculation:
- Original timeline: 6 months to launch
- With Copilot: 5.1 months to launch (0.9 months saved)
- Monthly burn rate: $100,000
- Cost savings from faster launch: $90,000
- Copilot cost: $19 × 12 developers × 12 months = $2,736 annually
- Net ROI: 3,190% ($90,000 savings – $2,736 cost = $87,264 benefit)
Summary
Monitoring and visualizing GitHub Copilot metrics through ES + Grafana provides engineering leaders with real-time insights into their AI tooling investments. By tracking key metrics like code acceptance rates, active user engagement, and adoption status across teams, organizations can accurately measure the tangible impact on developer productivity and calculate precise ROI figures. Grafana’s powerful visualization capabilities transform complex usage data into clear, actionable dashboards that help justify AI investments, identify adoption patterns, and optimize tool utilization. This transparent, data-driven approach not only validates the business value of Copilot but also helps teams fine-tune their AI assistance strategy based on concrete metrics rather than anecdotal evidence. For engineering organizations looking to quantify the benefits of AI-powered development, this monitoring solution offers an essential bridge between raw metrics and meaningful business outcomes.
Hi,
I like Copilot and Metrics Viewer a lot and I don’t doubt that there’s value in AI-assisted coding. But the ‘ROI’ calculation is just management candy.
Why 0.4h and not 0.3h, 1h or any other number which supports your case? IMO calculating the value (not guessing) is a very nuanced discussion with many dimensions to be considered.
In case you did a more thorough analysis/measurement(s) to calculate the time savings I would be very interessted to learn about your methology.
Kind regards m