We just announced previews for three exciting Xamarin platform features we’re introducing to make your development experience more enjoyable.
We’re making these previews available immediately to get feedback from our community and to help us focus our efforts.
Xamarin Android Player
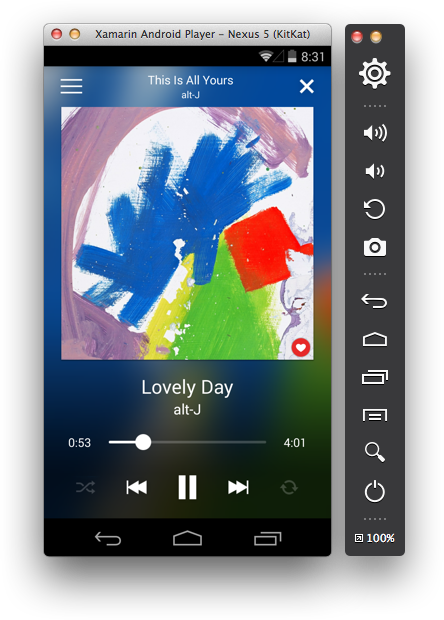
We decided to tackle the single greatest pain point all Android developers face every day — the outdated, slow and clunky experience provided by the Android emulator. Our new Xamarin Android Player runs with hardware-virtualization on your Windows or Mac desktop to give your apps the shortest startup time and best possible performance through hardware-virtualization and hardware-accelerated graphics.

The Android Player is built using Xamarin.Mac on OSX and WPF on Windows, and sports native user interfaces that have been customized for each platform following the idioms of Mac and Windows respectively. We have provided a great user interface to help you simulate battery state condition as well as the GPS location as well as integrating directly into ADB, allowing any existing Android tool to work directly with our high performance emulator.
We have made it very simple for developers to install Android APKs and to add Google Play Services. Merely drag and drop the APK into your Xamarin Android Player and have it run.
This current preview ships with Android KitKat 4.4.2, API Level 19 and a single form factor, and is free Free for current Xamarin subscribers. By launch, we will be distributing Android images for all the major API levels and form factors as well as a few nice surprises.
Sketches
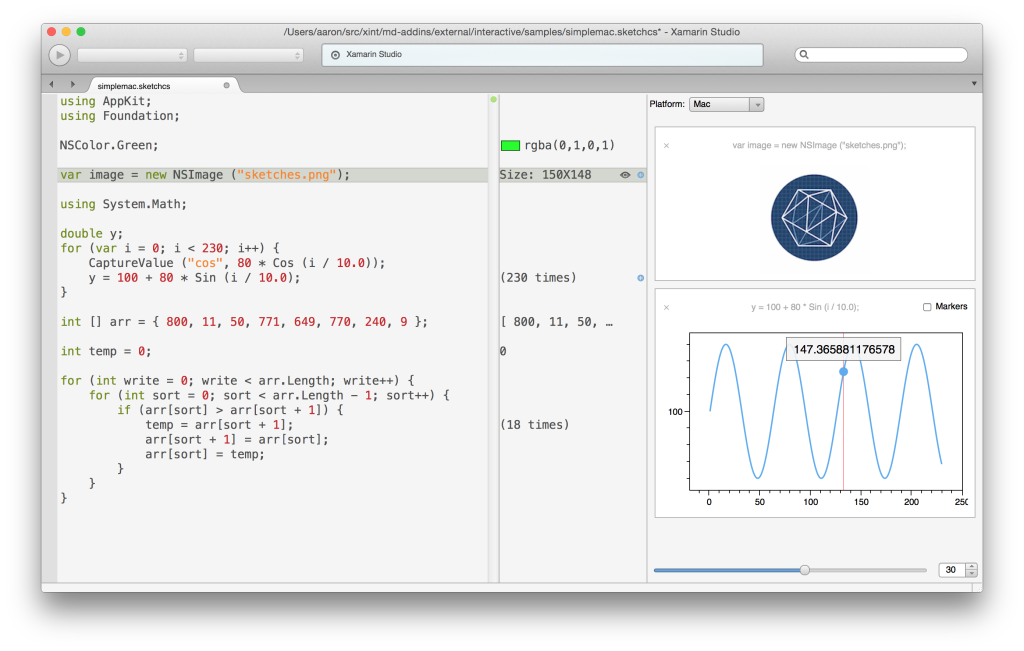
Sketches make C# and F# more accessible than ever.
We wanted to improve upon the standard write, build, deploy, test cycle, and Sketches does just that. Start writing code and watch it run; you can see both the intermediate results for the code that you are writing, as well as the effect that they have on the user interface.

Sketches are ideal to learn new APIs, prototype ideas, and quickly iterate on designs. When you find code that works for you, it’s easy to copy it into your app. Or, you can take snippets from your open solution and study them in an isolated live coding environment. This is an incredibly powerful tool for debugging.
Sketches are available today for iOS, Android, and Mac as a preview in the Xamarin Studio Beta Channel, and are coming soon to Visual Studio for Android, iOS and Windows.
To learn more, check out our Sketches documentation.
Profiler
Profiling is detective work. It’s like solving a mystery or diagnosing a patient – developers have to use their skills to piece together the whole picture, but a good diagnostics tool, like a good magnifying glass or a stethoscope, can help the developer by gathering the clues required to solve the puzzle. That’s why we’re extremely excited to introduce the Xamarin Profiler for your Xamarin mobile apps.

The Xamarin Profiler is a tool that helps you dissect, analyze, and polish your C# mobile applications. The profiler collects information about the managed side of your Xamarin iOS and Android applications and helps you to figure out where to spend the most time making improvements. You can it to find memory leaks, resolve performance bottlenecks, and add polish to your applications before getting them out the door.
The Xamarin Profiler comes in two native versions – Mac and Windows – that integrate seamlessly with your existing Xamarin toolchain. It is available for a public preview download here.
