

Imagine creating extensions that run faster and smoother than ever before! If you haven’t been following along lately, we’ve been working on improving the VisualStudio.Extensibility SDK. VisualStudio.Extensibility helps you build extensions that run outside the main IDE process for improved performance and reliability. With it comes a sleek and intuitive .NET 8-based API and comprehensive, well-maintained documentation to help you develop awesome extensions.
This 17.10 release builds on our previous releases, and it brings with it a brand-new debugging experience to make it easier for you to get your extensions running just the way you’d expect. We’ve also enhanced our remote UI features, added a new way to prompt users, and continued to add features to our project query API.
Please visit https://aka.ms/VisualStudio.Extensibility for the latest up-to-date docs and installation instructions. We encourage you to report bugs and suggest features via the issue tracker on our GitHub repo, where you can also find extension samples to help you get started.
What’s new for VisualStudio.Extensibility?
Do you want to develop and debug your extensions more quickly and more easily than before? Our 17.10 release adds the following features to help you do just that:
- Debug your extension using our new Diagnostics Explorer
- Leverage XAML Resources in your UI
- Let your extension users pick files or directories
- Track project changes with an improved query API
Debug your extension using our new Diagnostics Explorer
We’ve created a powerful new tool for debugging your extensions called the VisualStudio.Extensibility Diagnostics Explorer, available here in the Visual Studio Marketplace. With it, you’ll be able to see extensions the way that Visual Studio sees them to help ensure that you’ve configured yours correctly.
This tool, which itself was written as an in-process VisualStudio.Extensibility extension, can help you answer questions like “why isn’t my command showing up where I expect it to be in the IDE?” or “why isn’t my extension being activated when I expect it to be?”
Inspect configuration
VisualStudio.Extensibility has already made it easier for you to configure your extensions by eliminating the need for you to manually maintain separate metadata files. Now, we’re building on that with the Diagnostics Explorer, which lets you see exactly which extensions and components were discovered by Visual Studio, along with the configuration of each discovered item.
For example, if you weren’t seeing your command in the IDE, you could use the Command tab Diagnostics Explorer to view any commands that have been contributed to Visual Studio. If it’s not present in the list, that’s a hint to double check your configuration to make sure it gets discovered. If it’s present, but not enabled or visible, you may want to check your activation constraints. And if it’s marked as enabled and visible, you could use the dropdown menu to view command placements to make sure you’ve placed it correctly.
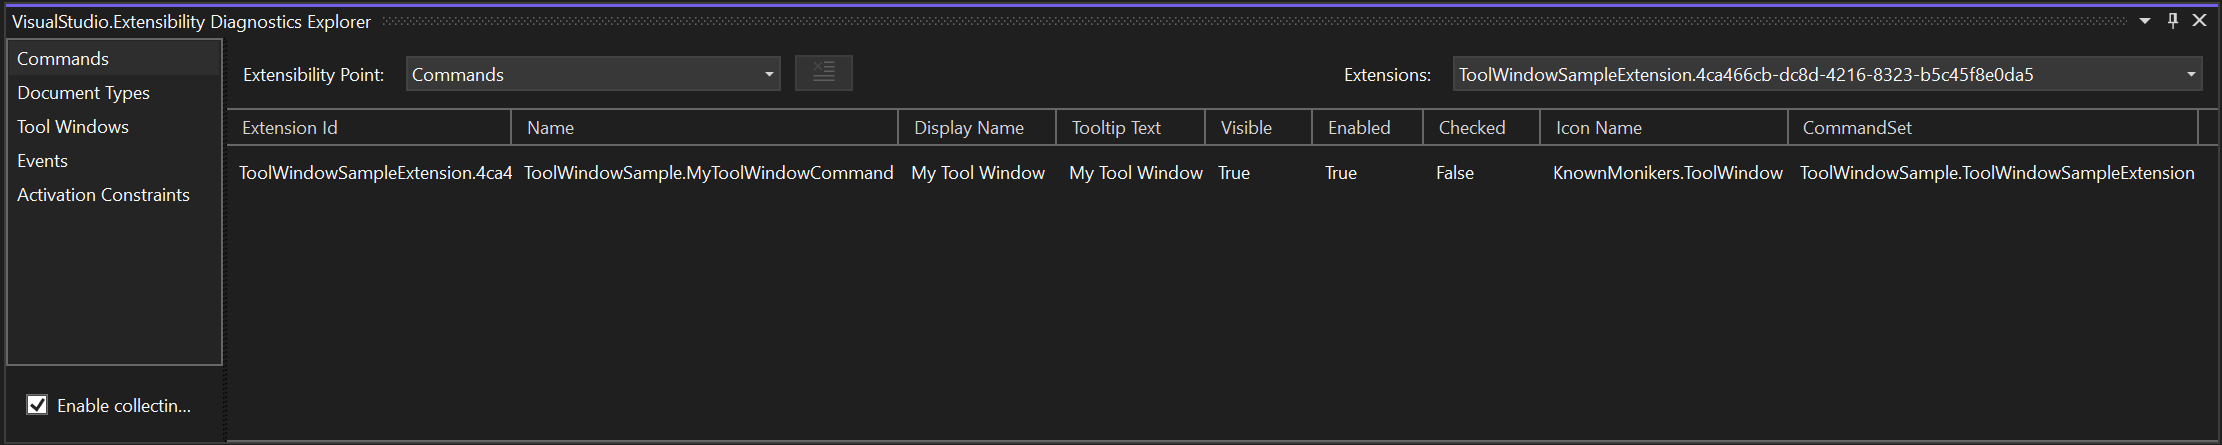
Using the Commands tab, you can inspect commands, command sets, groups, menus and toolbars, command placements, and dynamic command anchors. Other tabs let you inspect components for other feature areas including tool windows, document types, text views, and more. As we add features in future releases, you’ll be able to inspect any new components alongside these in the Diagnostics Explorer.
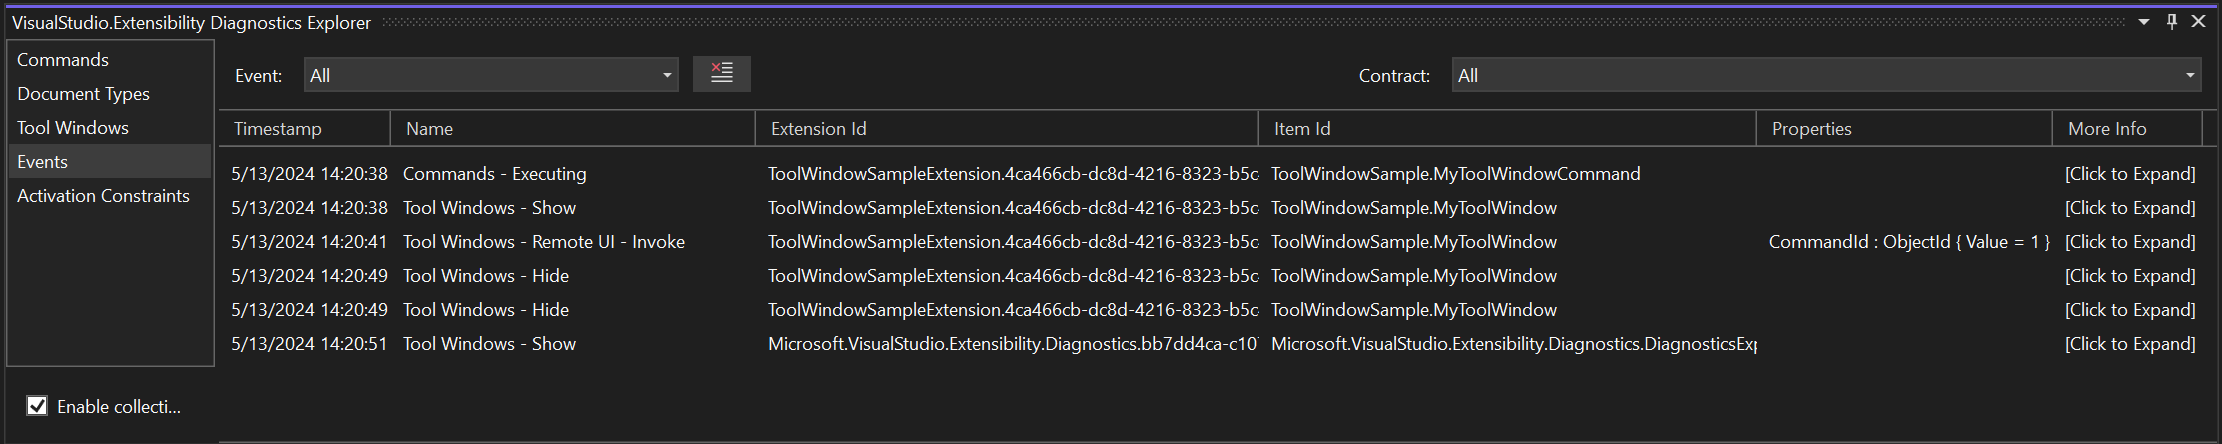
View live event log
We know that extension developers like you sometimes develop extensions that may need to handle events throughout the IDE, such as a command being executed, a tool window being opened, or a TextView being created, so we’ve added a live event viewer to enable you to observe these events and their properties in real time:
Create better activation constraints
The Activation Constraints tab in the Diagnostics Explorer gives you the current state for each of the values available to you when creating an activation constraint. Using this tab, you can get the IDE into the state that you want to use for your activation (such as building a project or opening a markdown file), and then you can inspect the values for each of the available expressions to help you create your constraint.
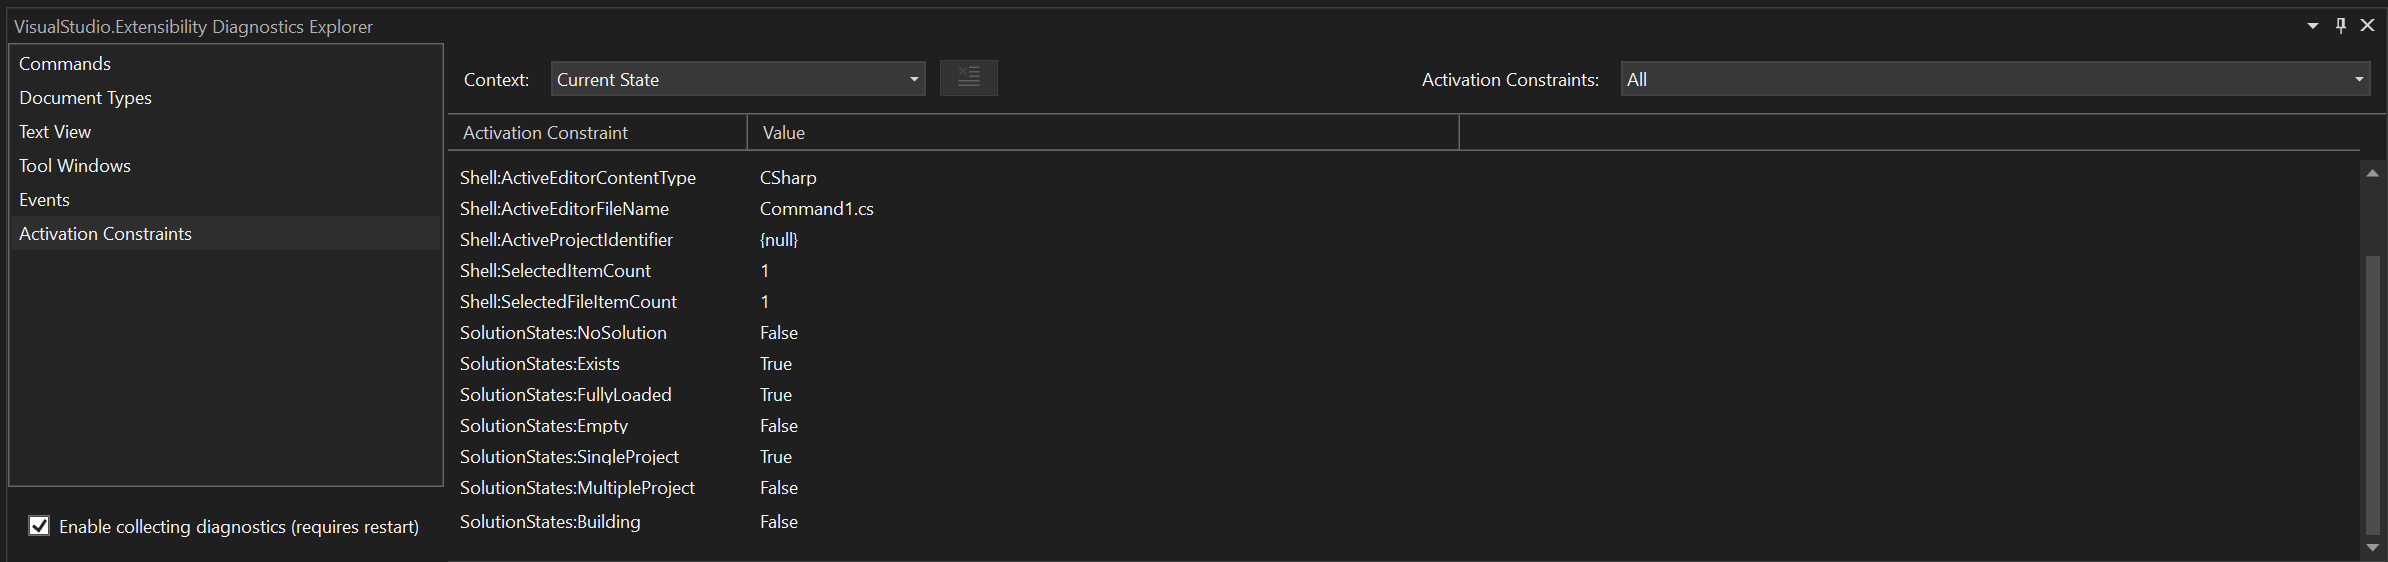
For example, suppose you wanted a command to be visible only if there’s a C# file open in the editor. With the Diagnostics Explorer, you could open a C# file and use the Activation Constraints tab to help you to determine which of the expressions you’ll need to craft your constraint:
EnabledWhen = ActivationConstraint.ClientContext(ClientContextKey.Shell.ActiveEditorContentType, "CSharp").
Leverage XAML Resources in your UI
XAML resources accelerate your UI development by letting you define objects like colors, brushes, or styles that you can leverage throughout your project. With this release of VisualStudio.Extensibility, we’re adding support for XAML resources to help you develop great UIs for your extensions!
Consistent with our other remote UI features such as UI controls, you’ll define any XAML files with ResourceDictionaries as embedded resources in your .csproj file:
<ItemGroup>
    <EmbeddedResource Include="\XamlResources.*xaml" />
    <Page Remove="XamlResources.*xaml" />
</ItemGroup>
Once defined, it’s easy to include your resources in other components so that they can be referenced in your XAML throughout your project:
ResourceDictionaries.AddEmbeddedResource("XamlResources.xaml")
You can even localize your resources: see the Modal Dialog sample for more information and let us know what you think!
Let your extension users pick files or directories
Building on our previous support for user prompts and custom dialogs, we’ve added the ability to display file and directory picker prompts from your extensions. For example, you can use the ShowOpenFileDialogAsync() method to prompt users to select a single file to open:
VisualStudioExtensibility.Shell().ShowOpenFileDialogAsync(options, cancellationToken);
Using the new APIs, you can prompt users to:
- Select a single file to open
- Select one or more files to open
- Select a single file to Save As
- Select a directory to open
As always, if there are other types of user prompts that are important for your extensions, please let us know through our Issues Tracker.
Track project changes with an improved query API
Our 17.10 release adds three new features to the project query API.
Track changes to query results
The TrackUpdatesAsync() method can be used in your project system queries to create an IObserver object to track changes to the state of the projects or solutions in your query. For example, if you want to track when updates made to the files in a project, you could use:
var query = await myProject
    .Files
    .With(f => f.FileName)
    .TrackUpdatesAsync(new TrackerObserver(), CancellationToken.None);
In this example, the TrackerObserver implements IObserver<IQueryTrackUpdates<IFileSnapshot>>, so you can use your own custom logic to handle the update events.
Query project rules
Each project in the project query API now contains a RulesResults attribute, which includes a rule name and a list of items. You can access these rules by calling RuleResultsByName() for a given configuration.
var results = await querySpace
    .Projects
    .With(p => p.Path)
    .With(p => p.ActiveConfigurations
        .With(c => c.RuleResultsByRuleName("CompilerCommandLineArgs")
            .With(r => r.RuleName)
            .With(r => r.Items
                .With(i => i.Name))))
        .ExecuteQueryAsync();
Skip results in a query
We’ve added the Skip() method to enable you to skip results in your query.
var projects = await queryableSpace.Projects
    .With(proj => proj.Name)
    .Skip(1)
    .ExecuteQueryAsync();
Here, the first project is skipped, and the remaining projects are returned.
We can’t do this without you!
We need your help as we continue to develop VisualStudio.Extensibility! Please try out this preview release and let us know what you think. Check out the docs, browse the code samples, and build your first extension. You can send feedback, report issues, or request features through our issue tracker.
You can also find information about breaking changes and known issues at our VisualStudio.Extensibility GitHub repo.
We’re prioritizing the features that our extenders ask for, so please give VisualStudio.Extensibility a try and share your thoughts with us!
0 comments