
I am really happy to announce that with the release of Visual Studio 16.8 Preview 3 you now have the ability to open and analyze managed dumps collected on Linux and use the best in class debugging tools available in Visual Studio.
Over the year’s Windows developer have grown accustomed to a broad variety of tools to help diagnose issues occurring with apps and services running on remote Windows machines. More recently we have empowered our developer community with the tools to develop and deploy apps across multiple platforms including many of the popular Linux distros.
Collecting and analyzing memory dumps remains a popular deep diagnostics technique, however, one of the primary limitations with cross platform memory analysis is that process dumps were not provided in a portable format. For example, it was not possible to directly diagnose a memory dump collected on Linux with the popular tools available on Windows.
Cross Platform Collection
Analyzing dumps is one of the most commonly used techniques to debug issues on remote machines, this is especially true when you do not have immediate access to your production environment. Developers will use a dump file from a machine when they can’t reproduce a crash or unresponsive program state on their own machine.
Here are some of my favorite tools for collecting dumps on Linux.
createdump
The createdump utility is an efficient mechanism for collecting memory dumps and can be run from the command line on any .NET Core processes.
sudo createdump <pid> --full
dotnet-dump
The dotnet-dump is global CLI tool (currently requires the .NET SDK) that provides a convenient way to collect Linux dumps even without a native debugger involved like lldb on Linux.
dotnet-dump collect -process-id <PID> -type Full
dotnet-monitor
We also have the ability to capture a variety of diagnostics artifacts including dumps and traces and quickly egress them to any other environment using dotnet-monitor.
dotnet-monitor is an experimental tool currently available as a .NET Core global tool and as a container image via the Microsoft Container Registry (MCR). The setup instructions for dotnet-monitor vary based on the target environment and platform, check out this post for more details.
Opening the Linux Core dump in Visual Studio
Memory dumps created on Windows machines have well known extension (*.dmp) and thus have a straightforward association with your favorite memory analysis tools. By default, core dumps produced on Linux machines are created without an extension.
If your managed core dump doesn’t have an extension you can drag and drop the file into your IDE and Visual Studio will automatically identify and open it as a Linux core managed memory dump.
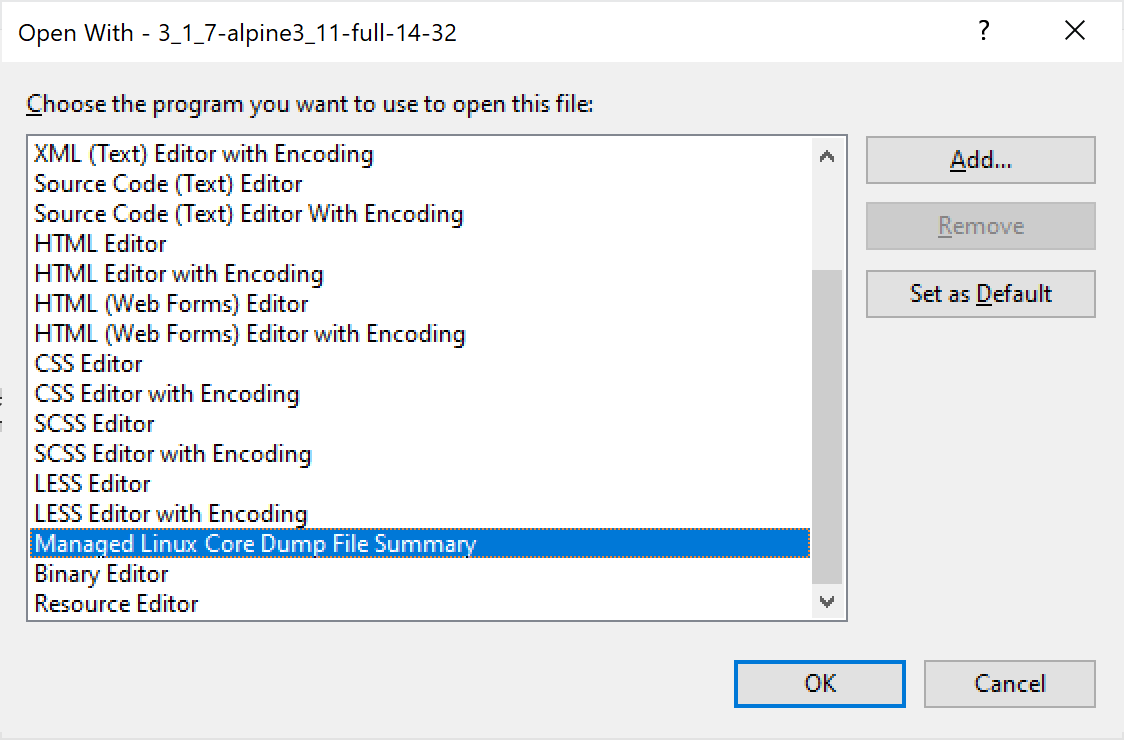
However, if the file was renamed to include the Windows dump extension (*.dmp) then use Visual Studio’s “Open with” feature in the Open File dialogue box.
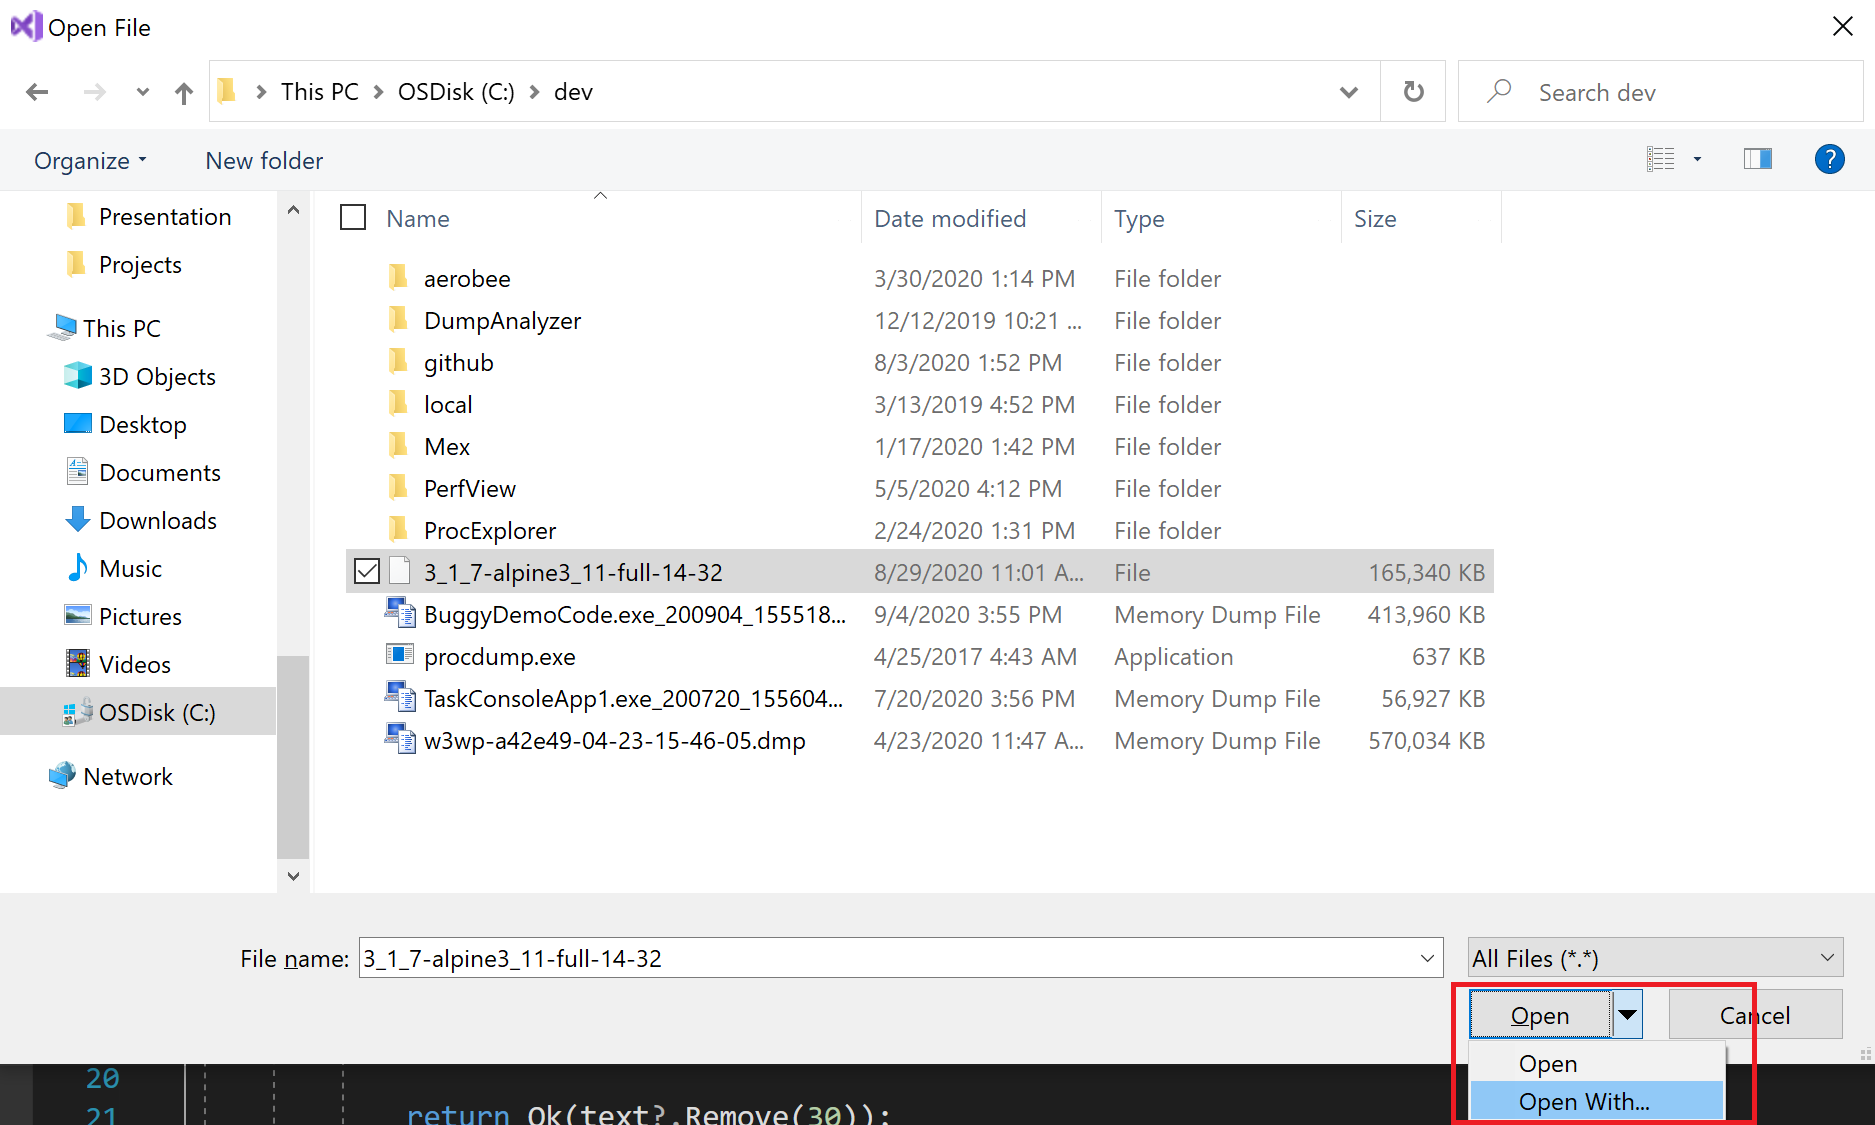
Select “Managed Linux Core Dump file summary”.
Linux Core Dump File Summary
The Managed Linux Core Dump File Summary window shows a summary and module information for the dump file, and a list of Actions you can take, this remains consistent with existing dump handling experiences in Visual Studio.
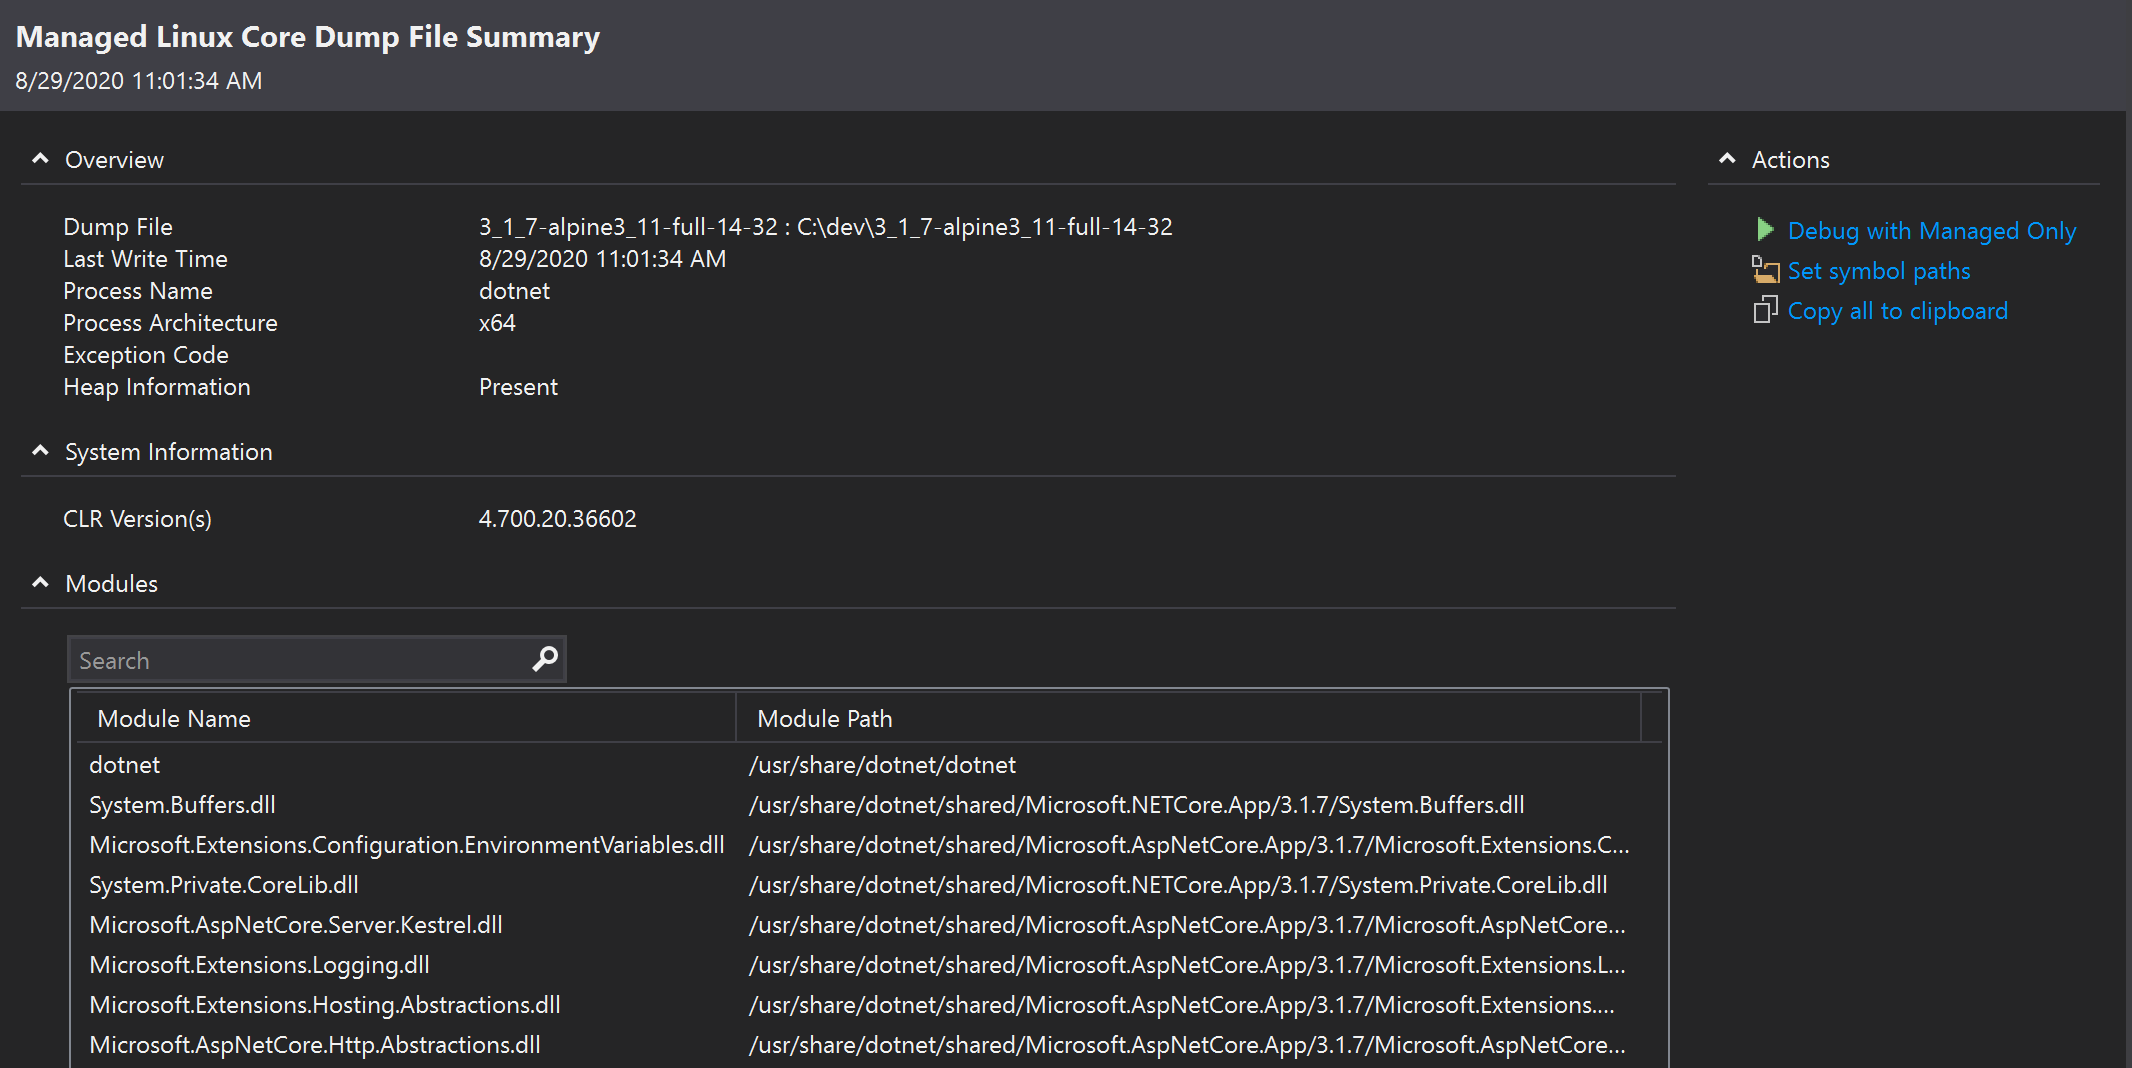
From this window you can conveniently set your symbols paths, which allows you to point to program database (.pdb) files, also called symbol files. The .pdb file holds debugging and project information, and the Visual Studio debugger will use .pdb files to determine the source file name and line number. This makes it easier to determine the exact line of code being executed when the memory dump was taken.
To start debugging, you can select Debug with Managed Only from the Actions section of the summary page and to start using the awesome debugging tools you have become accustomed to.
You could, for example, start by reviewing the list of Threads or Tasks using the Parallel Stacks for Tasks window. Or dig a bit deeper by examining the most interesting frames from Calls Stacks view. That might also lead you to examine the value and state of variables using the Locals or Autos window. Essentially you get to examine every detail of the process just as if you set a breakpoint on your Linux box.
Please note the following limitations in our preview:
- The minimum supported .NET Core version is 3.1.7
- .NET 5.0-rc1 will be the first 5.0 supported version
- Preview 3 will only support full dumps (”Full” option using dotnet-dump). Full support for all dump options is anticipated for Visual Studio 16.8 Preview 4 & .NET 5.0-rc2.
- The ability to “Debug Managed Memory” (view the heap) is being developed for a future release.
- Support for Decompilation is currently in our backlogs and scheduled for release in Preview 4.
- Preview testing included Linux core dumps generated on the following amd64 docker .NET images:
- buster-slim (Debian 10)
- alpine (Alpine 3.11 & 3.12)
- focal (Ubuntu 20.04)
- bionic (Ubuntu 18.04)
If you are interested in “Native Only” dump debugging for Linux systems for unmanaged C++ please check out the blog post here.
Try it out!
Debugging managed Linux core dumps on Windows has been difficult to accomplish until now, it might mean setting up another Linux environment that exactly mirrored production and then installing a set of tools for the analysis. Thankfully with the latest Visual Studio 2019 16.8 preview you can simply drag and drop a managed Linux core dump directly into your IDE and immediately start debugging.
Please reach out to us on the Developer Community to site to suggest and/or vote on features, help us prioritize what is most important to you!
Core dump need mscoredbi.dll?
Debugging managed core dumps is similar to other .NET debugging scenarios, Visual Studio finds and downloads the right versions of mscordaccore.dll and mscordbi.dll from the public Microsoft symbol server so it can understand the internal data structures of that particular build of the .NET runtime. You can find more information here: https://devblogs.microsoft.com/dotnet/announcing-net-5-0/#dump-debugging , https://github.com/dotnet/runtime/blob/master/docs/design/coreclr/botr/dac-notes.md
But visual studio not found(404) mscordbi.dll on Microsoft symbol server.
Is there an error message you are seeing?
All right now
Looks like a very interesting feature!
But doesn’t work here:
VS2019 16.8.0 Preview 4.0
Process on Linux, ARM32, selfcontained, NET5.0 RC2, Trimmed.
“Managed information is not available for this minidump.
The debugee memory space does not have the expected debugging export table.”
Let someone know that the purple “Visual Studio Roadmap” button on the “Release Version” tab at this page:
https://developercommunity.visualstudio.com/spaces/8/index.html
does not work, it doesn’t take you to the roadmap. This is what happens when you don’t link the button to the actual page, but instead use some redirection service.
Thanks for the heads up. It’s now fixed.