
With ASP.NET core, my life as a Windows-first developer just broadened dramatically. I can now develop apps without being tied to a single platform. Having spent most of my career as a “Windows only” developer, I am now taking on the task of redesigning a twenty-year-old, IIS based service, so that it could be built on a Mac and hosted on Linux in Azure.
Given these new hosting possibilities one of my pressing concerns was how little I knew about the Linux world in general and, more specifically, what tools and techniques I could use when debugging complex issues in production. Thankfully for me, Visual Studio 2019 Enterprise has expanded support to include Azure Kubernetes Services (AKS) managing Linux containers.
Debug without interruption in AKS
Why Snapshot Debugger? Diagnosing production issues in the cloud can be difficult and time consuming because you may be dealing with issues that only occur at scale or in specific environments, and your favorite debugging tools are often unavailable. Remote debugging your production site is rarely an option because it is serving live traffic, and any action that stops the web process would immediately impact your customers.
Snapshot Debugger is built for production and works at cloud scale. If you are familiar with breakpoints and tracepoints in VS for debugging local code, then Snappoints and Logpoints are similar but for debugging against apps running in production (without stopping execution). You are able to attach to these snapshots within the familiar and intuitive environment of Visual Studio and analyze specific lines of code using your Locals, Watches and Call Stack windows.
Prepping your Dockerfiles for Snapshot Debugger
Setting up Snapshot Debugger to work with AKS Linux Docker containers requires the following Dockerfile prerequisites:
- Install Snapshot Debugger prerequisites (libxml2, libuuid, libunwind, bash, unzip).
- Install Visual Studio Snapshot Debugger components.
- Set environment variables to load Visual Studio Snapshot Debugger into your .NET Core applications.
- Install Visual Studio Debugger components.
We have provided a repo containing a set of Dockerfiles that demonstrate the setup on Docker images for several Linux variants. Each file includes the latest supported Snapshot Debugger backend package and sets the environment variables to load the debugger into your .NET Core application.
| Linux variant | .NET Core | |
| Debian 9 (Stretch) | 2.2 | Dockerfile (amd64) |
| Alpine 3.8 | 2.2 | Dockerfile (amd64) |
| Ubuntu (Bionic) | 2.2 | Dockerfile (amd64) |
Setup Snapshot Debugger for AKS in your ASP.NET Core project
You can use the following instructions to provide Snapshot Debugger support your ASP.NET Core web apps:
- In Visual Studio 2019, configure your Web application to use Docker
-
- Right-click on the web application Add->Docker Support
- Target OS: Linux
- Select a version of Linux to use from the Visual Studio Snapshot Debugger Docker image repository and merge it with the Dockerfile created for your web application. An example of a merged Dockerfile can be found here.
- In Visual Studio, rebuild your web solution to create a new docker image.
- Tag your local image. In the following example I rename “dasblog-core” to “poppastring/dasblog-core”:
- docker tag dasblog-core poppastring/dasblog-core
- Push the newly tagged image to your image repository (using docker in this example).
- docker push poppastring/dasblog-core
- Deploy your application to AKS. More details on deploying to AKS with Cloud Shell and Azure CLI can be found here. Additionally this sample YAML file sets up a basic deployment and service scenario.
- Choose Debug > Attach Snapshot Debugger and select the Azure Kubernetes Service your project is deployed to along with an Azure storage account and click Attach. You are now in snapshot debugger mode!
- In the code editor, click the left gutter to create a Snappoint and click Start Collection to deploy your Snappoint to Azure.
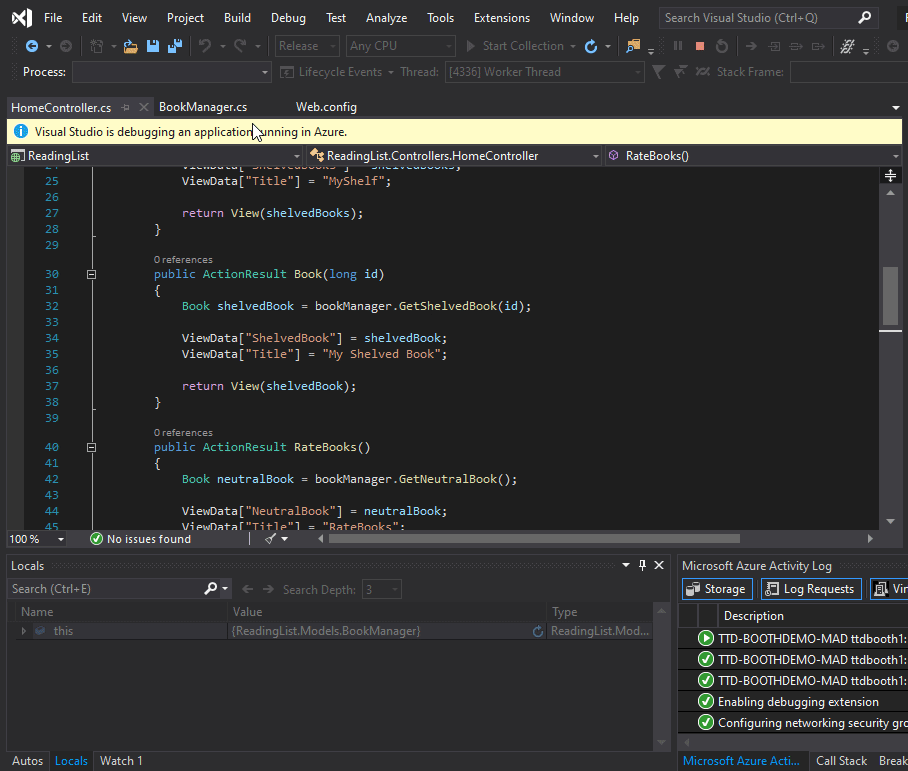
- Navigate to your service to execute the code represented by the Snappoint.
- Once your Snapshot has been collected, in Visual Studio click on View Snapshot to view your Locals, Watches and Call Stack windows at that moment in time.
Check out this video where I use Snapshot Debugger to uncover a flaw in my open source code hosted in Azure. You can also find additional details on Debugging live Azure Kubernetes Services here.
Try it out!
We are excited to be able to offer first class production diagnostics support with Visual Studio 2019 Enterprise and Snapshot Debugger. Snapshot Debugging is now supported in Azure Kubernetes Services as well as Azure App Services, Azure Virtual Machines and Azure Virtual Machine scale sets. We encourage you to try out the new capabilities in your solution and we look forward to hearing your feedback and how we can make this feature better.
We’re also working towards adding support for ASP.NET Core 3 and additional Linux versions in the near future, so be sure to follow our Dockerfile repo for updates.
Does this include support for Application Insights snapshot debugging features?
https://docs.microsoft.com/en-us/azure/azure-monitor/app/snapshot-debugger
Hi Brian,
These features are quite distinct, Application Insights Snapshot Debugging feature focuses on capturing snapshots when an exception occurs. You then get to open that Snapshot in the Azure portal or download it for Visual Studio.
This feature approaches Snapshots Debugging from a code first perspective.
Thanks for the question!