


When a distributed application feels slow, the user sees one delay. The code behind that delay may run across a web frontend, backend services, databases, and external APIs. If you profile only the frontend while the backend is slow, the profiler can show that the frontend is healthy without revealing the actual bottleneck.
This article shows how to narrow a cross-process performance problem with Visual Studio: identify the process that owns the slow operation, capture its CPU activity, inspect the report, and add a focused measurement when CPU samples cannot explain elapsed time. GitHub Copilot Profiler Agent reinforces this workflow with detailed analysis of the captured profile and helps validate the interpretation of the evidence.
The case study uses the Interview Coach sample, a .NET Aspire application with a Blazor frontend and several backend resources. The eventual cause is in an AI streaming path, but the investigation applies to any distributed .NET application where one user action crosses process boundaries.
One symptom, several processes
The Interview Coach Web UI sends a prompt to a backend agent and renders the response as a stream of updates. I tested it with this prompt:
Hi, I'm Peter. Here's my resume: https://justinyoo.github.io/fake-resumes/resume-peter-parker.pdf.
And this is JD: https://justinyoo.github.io/fake-resumes/jd-cloud-solution-architect.pdf
The first complete response took roughly 1.5 to 2 minutes. Some of that time was expected: the first turn parses the PDF into Markdown and stores initial data in Cosmos DB. Even with that work in mind, the response felt slower than expected.
One interaction crossed the Blazor Web UI, the agent, MCP servers, Cosmos DB, and a hosted model. Before looking for a slow method, I needed to establish which process was doing work and which process was waiting.
Visual Studio’s Performance Profiler was a good place to start.
Define the question before collecting data
I reduced the investigation to two questions:
- Which process owned the slow part of the interaction?
- Once that process was isolated, was it computing or waiting?
AppHost starts the Web UI, agent, MCP servers, and data services as separate processes. A profile of InterviewCoach.AppHost describes the orchestrator. It does not automatically describe the Blazor code in InterviewCoach.WebUI.
CPU Usage can collect from multiple processes, which is useful for an initial system-wide view. Here, the visible slowdown occurred while the Web UI consumed and rendered updates, so I wanted a focused capture of that process. I kept the backend resources under Aspire and launched the Web UI as the Visual Studio profiling target.
Target the process that owns the work
This walkthrough assumes the sample is configured for local Azure provisioning and already runs successfully from Visual Studio.
Set InterviewCoach.AppHost as the startup project, select its HTTPS launch profile, and choose Debug > Start Without Debugging. Starting without the debugger leaves AppHost running when the startup project changes later. Once the Aspire resources are ready, stop only the Aspire-managed webui resource from the Aspire dashboard. Leave the agent and its dependencies running.
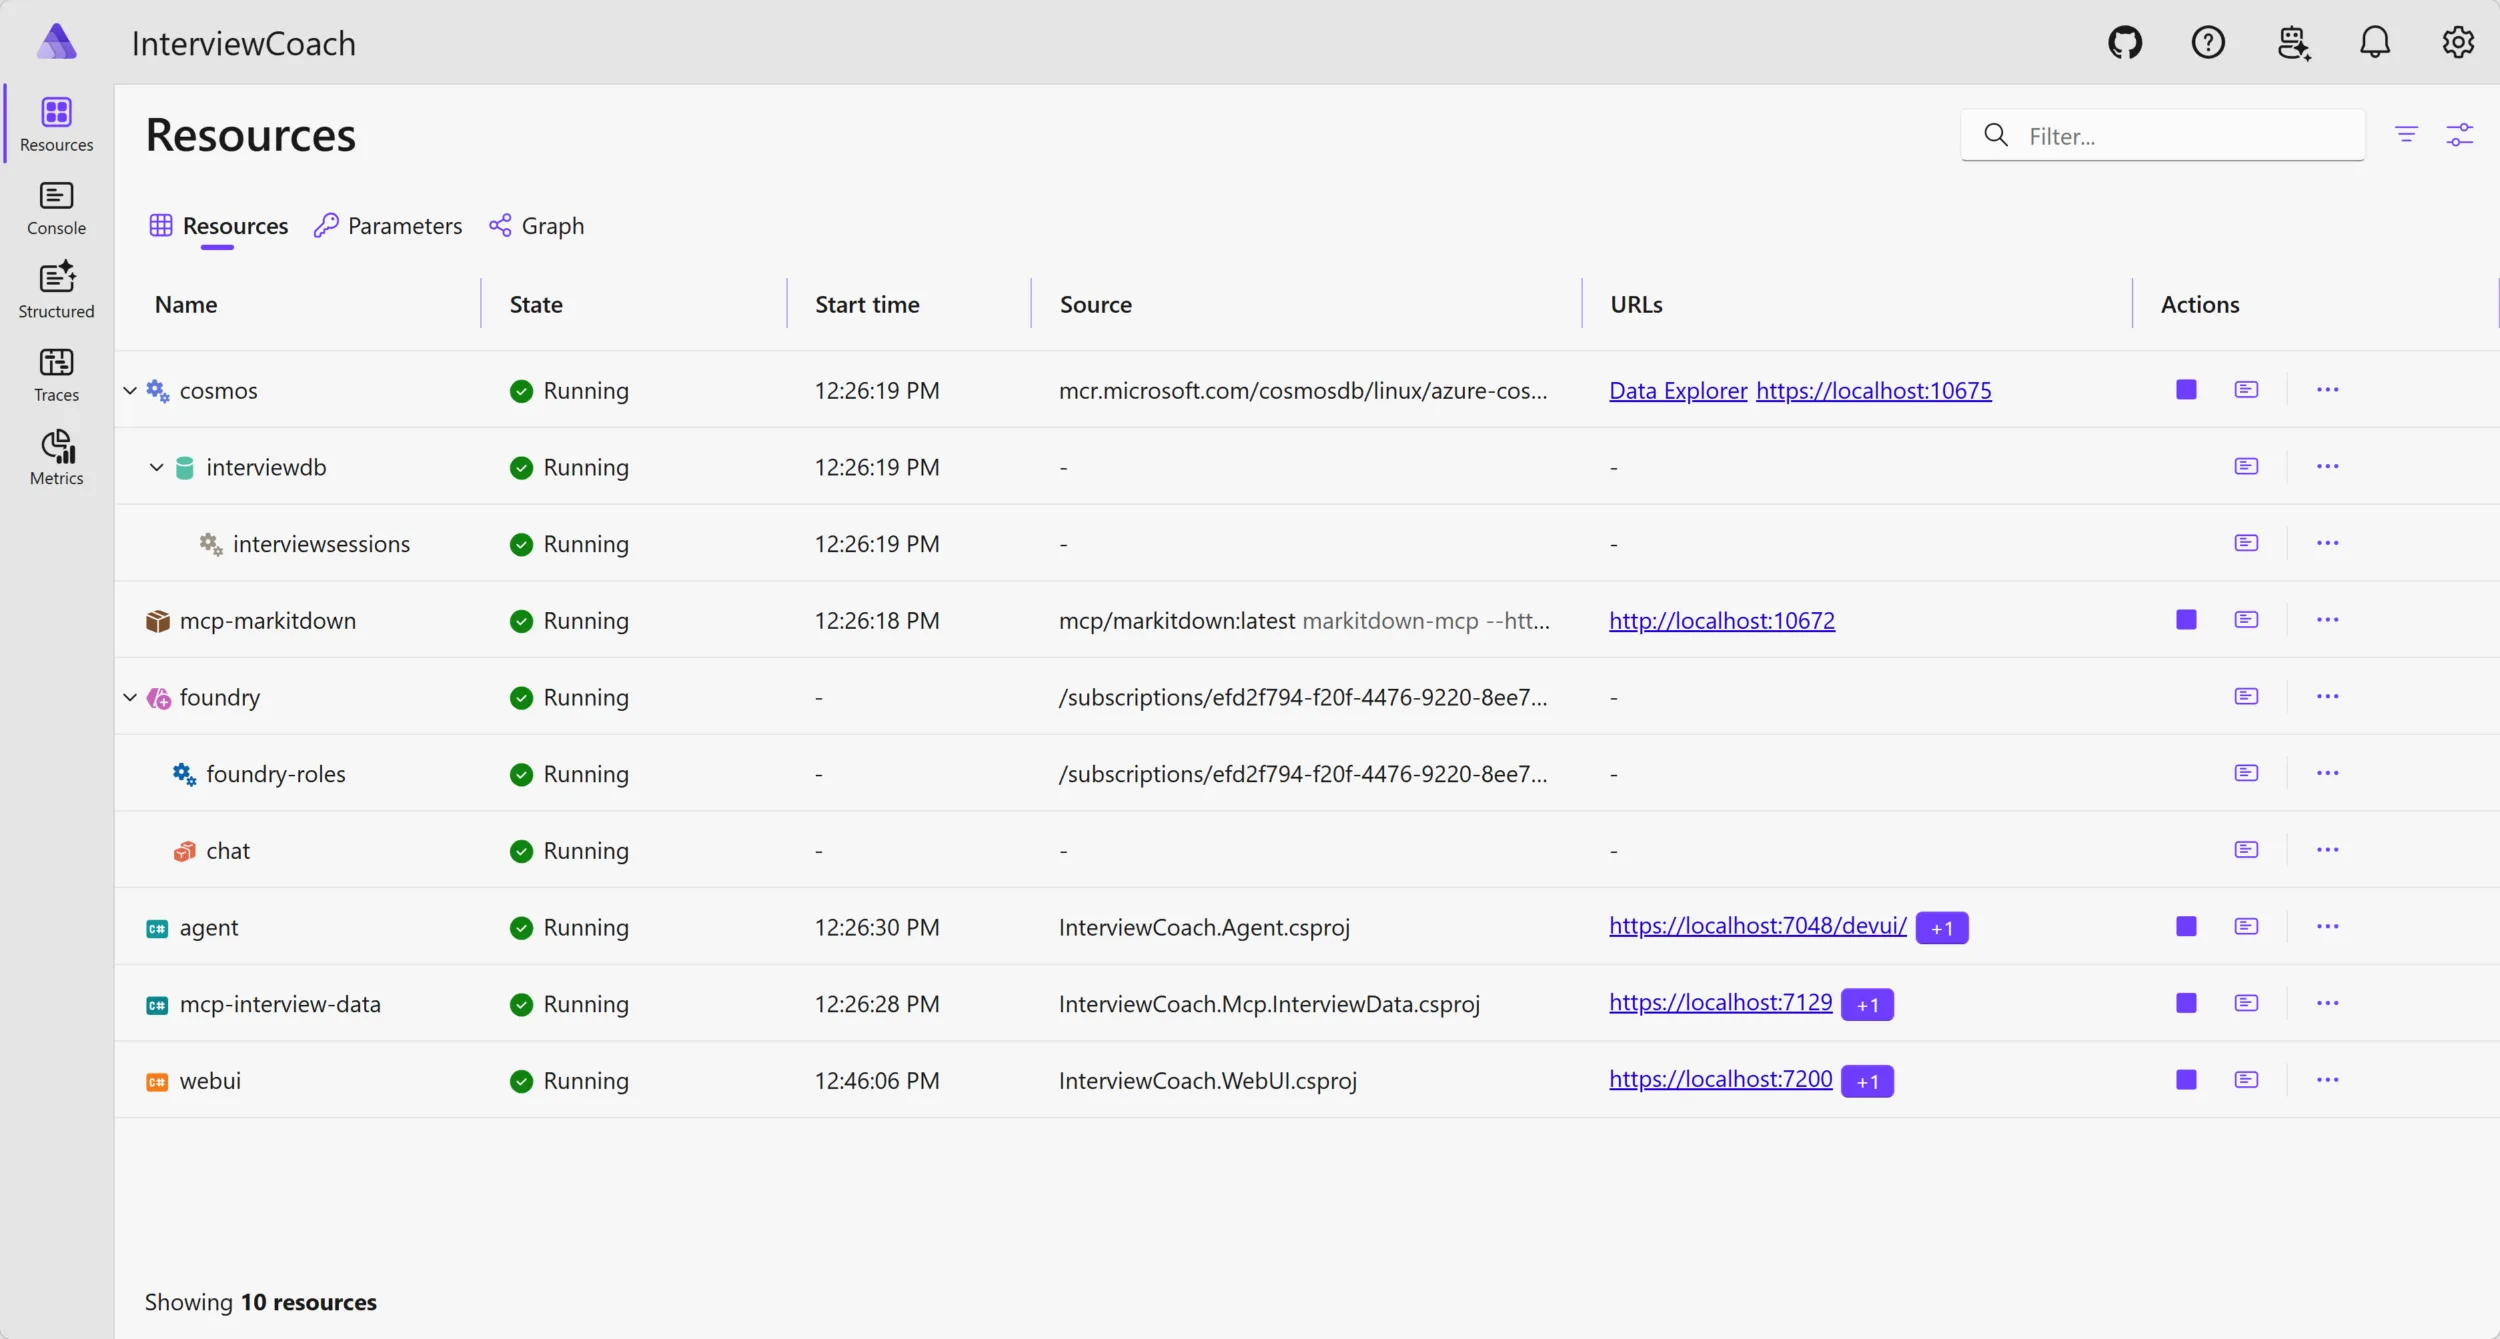
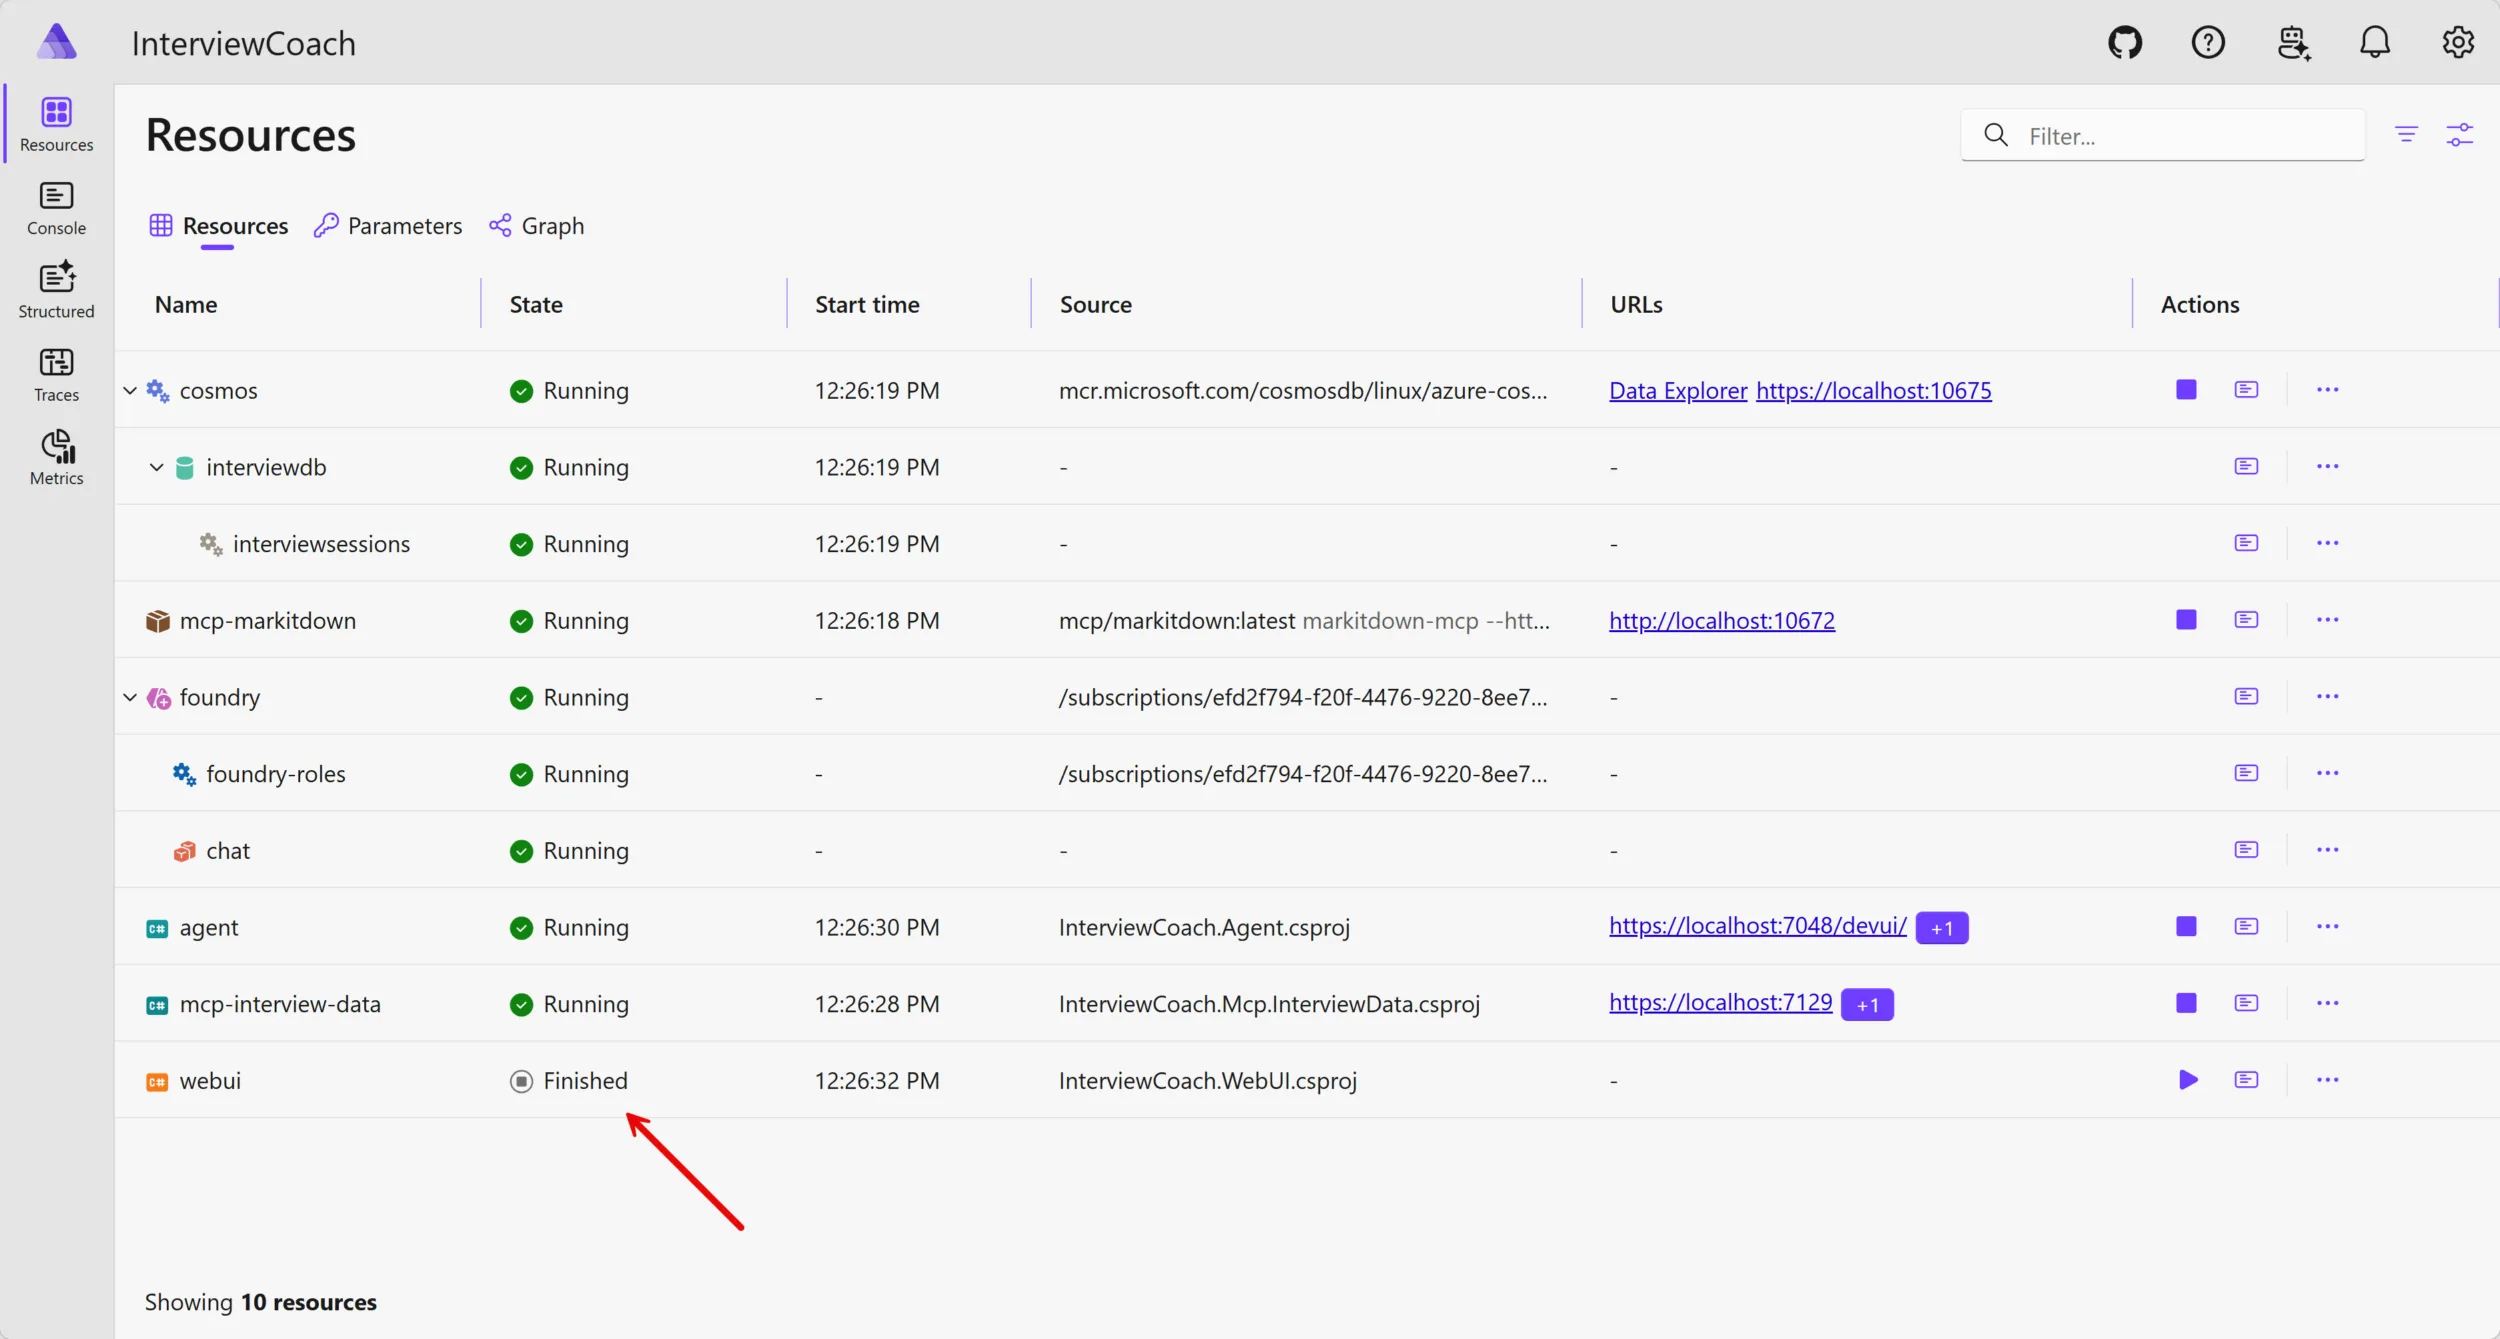
The standalone Web UI needs a launch profile that uses its own ports and points service discovery at the running agent. In this capture, the agent’s HTTPS endpoint used port 7048. Aspire can assign a different port after a restart, so use the value shown in the dashboard.
Add a Profiler profile under profiles in src/InterviewCoach.WebUI/Properties/launchSettings.json:
"Profiler": {
  "commandName": "Project",
  "dotnetRunMessages": true,
  "launchBrowser": true,
  "applicationUrl": "https://localhost:7201;http://localhost:5088",
  "environmentVariables": {
    "ASPNETCORE_ENVIRONMENT": "Development",
    "Services__agent__https__0": "localhost:7048"
  }
}
The Web UI addresses the agent through a logical service name:
client.BaseAddress = new Uri("https+http://agent");
The environment variable maps to Services:agent:https:0. The configuration-based service discovery provider resolves localhost:7048 as the HTTPS endpoint for agent. The value contains the host and port, not the https:// prefix.
In Visual Studio:
- Set
InterviewCoach.WebUIas the startup project. - Select the
Profilerlaunch profile. - Set the build configuration to
Release. - Open Debug > Performance Profiler, or press Alt+F2.
- Confirm that the target is
InterviewCoach.WebUI. - Select CPU Usage.
- Select Start with collection paused.
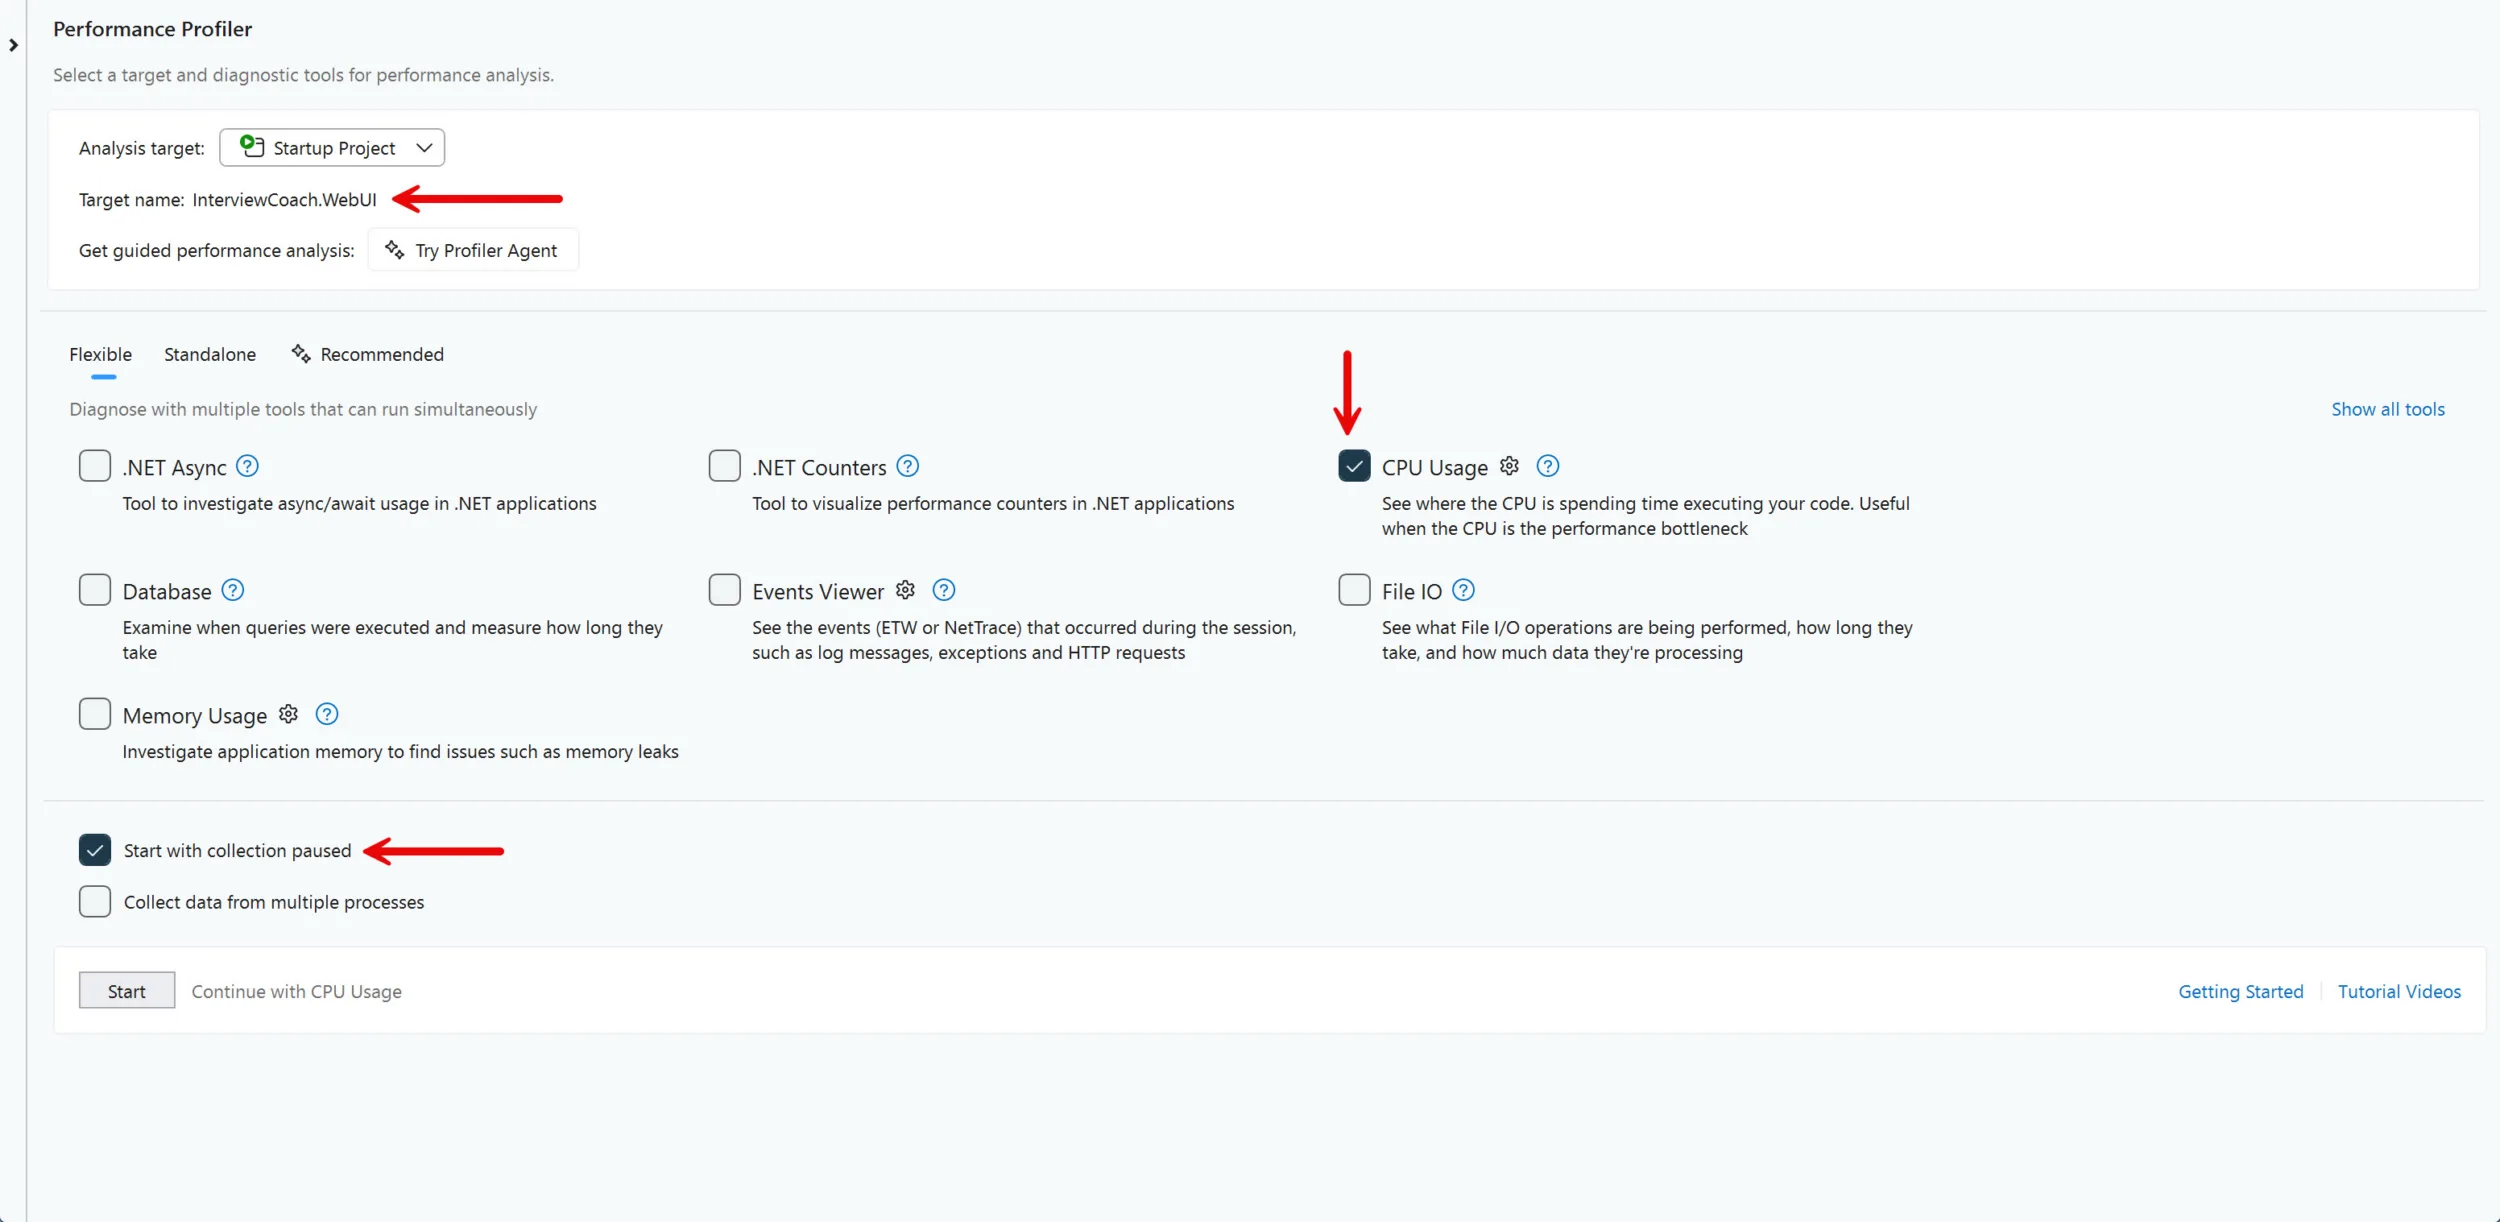
Start the application. When the Web UI is ready, resume collection, submit the test prompt, and stop collection when the response finishes.
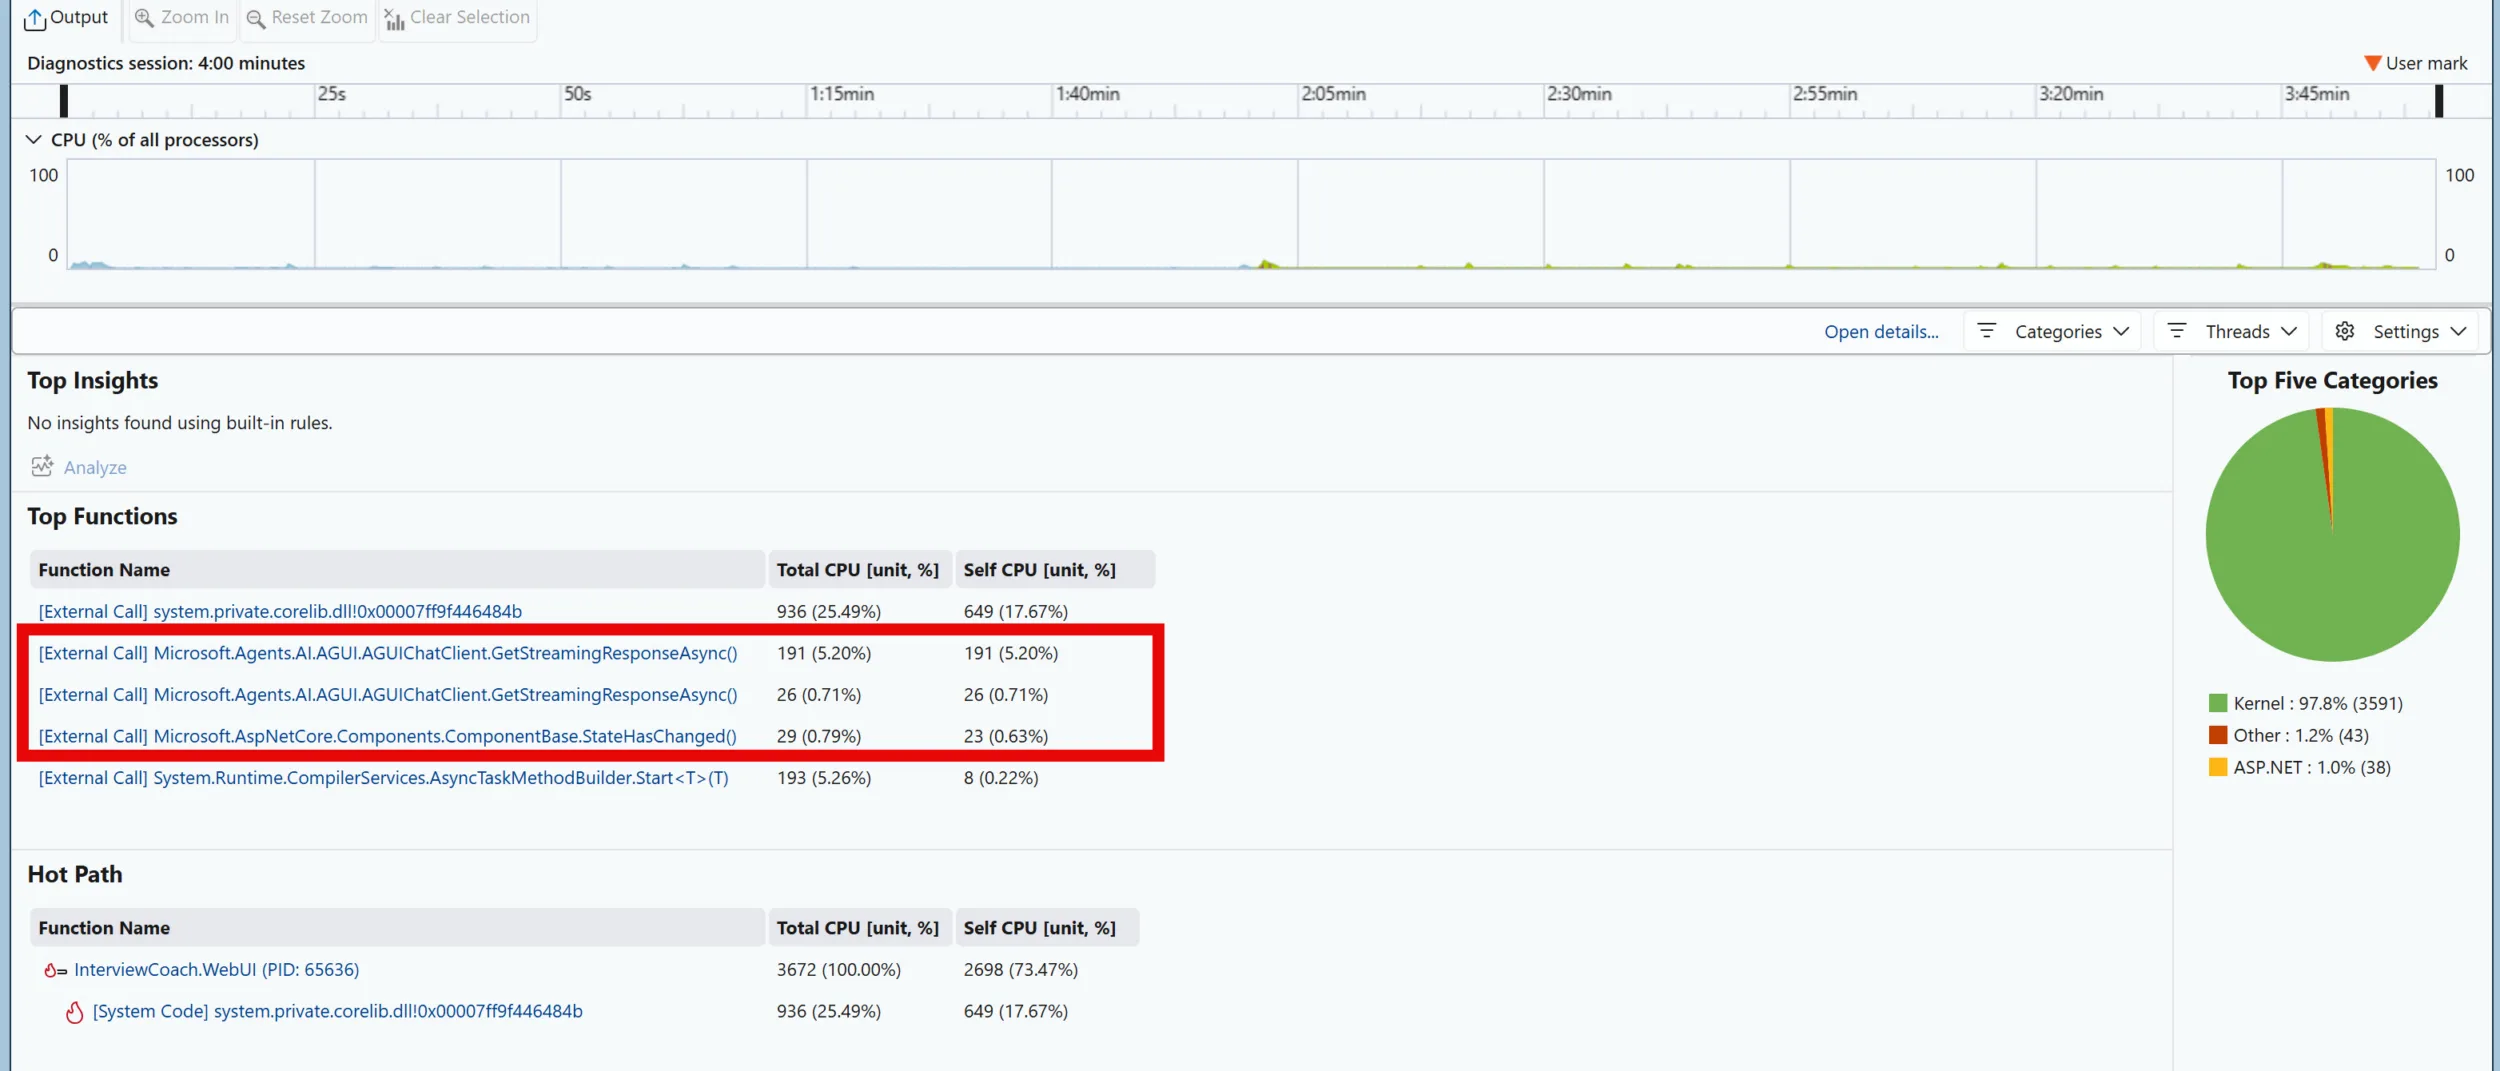
Read the CPU report before asking Copilot
Start with the CPU timeline. Select only the interval from submitting the prompt to receiving the final update. This removes startup and unrelated activity from the details below the chart.
Next, open Call Tree and enable Just My Code. The columns answer different questions:
- Total CPU includes CPU samples in a method and everything it called.
- Self CPU includes samples attributed directly to that method.
Use Expand Hot Path to follow the most CPU-intensive branch, then search for GetStreamingResponseAsync to find the Web UI’s streaming path. The Functions view is also useful for sorting application methods by Total CPU or Self CPU without navigating the entire tree.
In this capture, the selected interval reported 6.7% CPU usage, and the Call Tree did not show a dominant application hot path that accounted for the long response. That did not prove what caused the delay. It told me something narrower: the Web UI was not CPU-bound during the selected interval.
This distinction matters. CPU Usage samples active processor work. Time spent awaiting I/O, a timer, a lock, or another service can make the user wait without appearing as a CPU hot path. With no CPU hot path explaining the elapsed time, the next step was to inspect the code along the streaming path for an explicit wait.
Follow the evidence into the streaming loop
The response loop in src/InterviewCoach.WebUI/Components/Pages/Chat/Chat.razor contained a useful clue:
await foreach (var update in ChatClient.GetStreamingResponseAsync(
    outboundMessages,
    chatOptions,
    cancellationToken))
{
    await Task.Delay(50);

    messages.AddMessages(update, filter: c => c is not TextContent);

    if (update.Role == ChatRole.Assistant)
    {
        responseText.Text += update.Text;
        ChatMessageItem.NotifyChanged(responseMessage);
    }

    StateHasChanged();
}
This line pauses every streaming update:
await Task.Delay(50);
If a response arrives in 200 updates, the nominal accumulated delay is 10 seconds:
200 updates x 50 ms = 10,000 ms
The delay appears to pace updates before the UI refreshes. Regardless of why it was added, its cost grows linearly with the number of updates.
Measure the accumulated wait
CPU Usage cannot measure elapsed time spent awaiting Task.Delay. To capture that value, add @using System.Diagnostics to Chat.razor and place temporary counters around the existing loop:
var responseTimer = Stopwatch.StartNew();
var measuredDelay = TimeSpan.Zero;
var updateCount = 0;

await foreach (var update in ChatClient.GetStreamingResponseAsync(
    outboundMessages,
    chatOptions,
    cancellationToken))
{
    updateCount++;

    var delayStarted = Stopwatch.GetTimestamp();
    await Task.Delay(50);
    measuredDelay += Stopwatch.GetElapsedTime(delayStarted);

    // Existing update handling...
}

Logger.LogInformation(
    "Stream completed in {ElapsedMs} ms across {UpdateCount} updates; "
    + "artificial delay consumed {DelayMs} ms",
    responseTimer.Elapsed.TotalMilliseconds,
    updateCount,
    measuredDelay.TotalMilliseconds);
The code logs once after the response completes:
Stream completed in {{ total elapsed time }} ms across {{ number of streaming updates }} updates; artificial delay consumed {{ measured delay time }} ms
These are streaming updates, not model tokens. One response update does not necessarily represent one token.
Task.Delay(50) guarantees a minimum wait, not an exact resumption time. Thread scheduling and other work can make the measured interval longer than 50 ms.
I ran the same prompt five times.
Remove the delay and repeat
For comparison, I removed await Task.Delay(50) and ran the same prompt five more times. I left the timestamp calls in place temporarily so both versions produced the same log format. Without the awaited delay between them, those calls measure only instrumentation overhead.
The live model can produce a different response and update count on every run. Total response time therefore includes model and network variation. It is useful user-experience context, but the delay counter is the measurement that isolates the Web UI’s artificial wait.
Use Profiler Agent to deepen the analysis
After reading the report and measuring the suspected wait, I brought up GitHub Copilot Profiler Agent to analyze the CPU session in more detail and validate my interpretation. I gave it the method under investigation and the counter values:
@Profiler Review this CPU Usage session for InterviewCoach.WebUI. The response contained 193 streaming updates, took 84,813.9868 ms, and accumulated approximately 11,871 ms inside Task.Delay(50), or 61.5088 ms per update. Does the report show significant CPU work in GetStreamingResponseAsync, or is the elapsed time consistent with asynchronous waiting?
The question is deliberately narrow. Profiler Agent can help interpret the report, but the CPU profile still cannot measure the elapsed wait by itself.
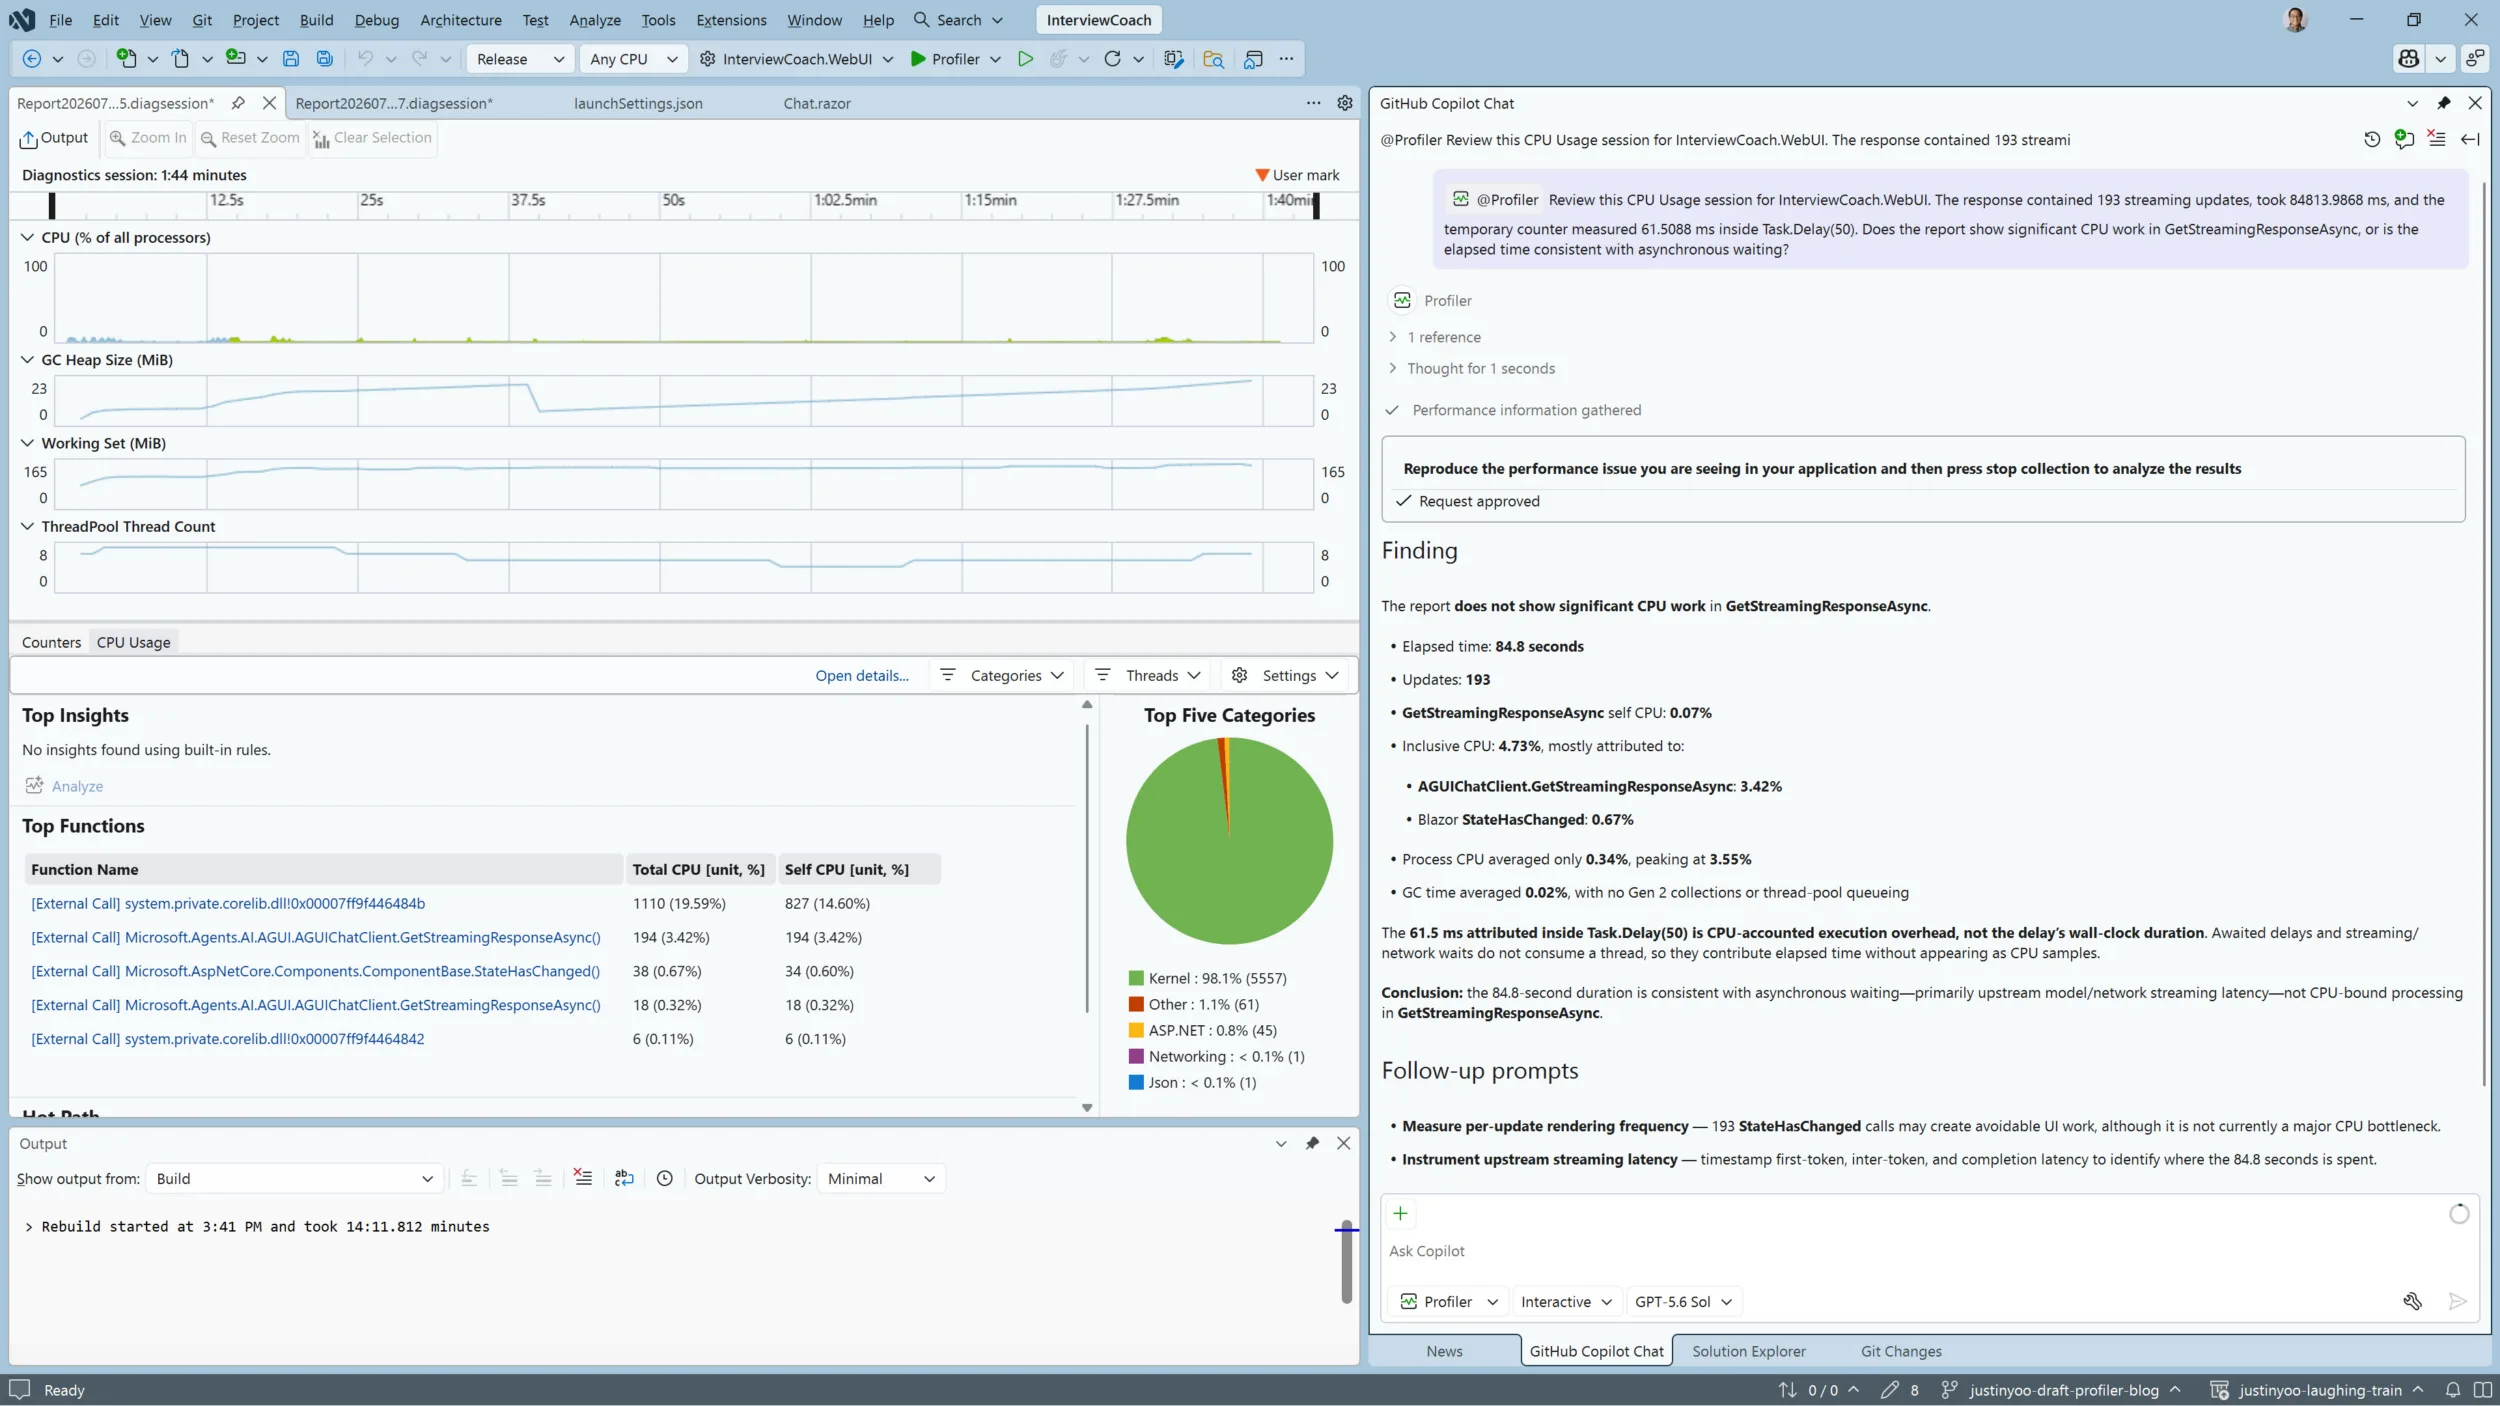
Profiler Agent reached the same supporting interpretation: response processing was not CPU-bound. The direct timer remained the evidence for the accumulated delay.
What the measurements showed
Baseline with Task.Delay(50)
| Run | Total elapsed (ms) | Update count | Expected delay (ms) | Measured delay (ms) | Delay/update (ms) |
|---|---|---|---|---|---|
| 1 | 92386.3482 | 168 | 8400 | 10299.8094 | 61.3084 |
| 2 | 84772.6630 | 188 | 9400 | 11549.6042 | 61.4341 |
| 3 | 90705.5531 | 153 | 7650 | 9376.8390 | 61.2865 |
| 4 | 79027.4327 | 147 | 7350 | 9028.3215 | 61.4172 |
| 5 | 69061.6113 | 190 | 9500 | 11714.1005 | 61.6532 |
| AVG | 83190.7217 | 169 | 8460 | 10393.7349 | 61.4199 |
| MED | 84772.6630 | 168 | 8400 | 10299.8094 | 61.4172 |
The five runs recorded between 9.03 and 11.71 seconds inside the artificial delay. The median accumulated delay was 10.30 seconds.
The measured interval averaged 61.42 ms per update, about 11 ms longer than the nominal 50 ms. The accumulated wait, rather than the difference between 50 ms and 61 ms, is the performance issue.
After removing Task.Delay(50)
| Run | Total elapsed (ms) | Update count | Measured timer overhead (ms) | Overhead/update (ms) |
|---|---|---|---|---|
| 1 | 98450.7463 | 226 | 0.0262 | 0.0001 |
| 2 | 69886.9730 | 174 | 0.0155 | 0.0001 |
| 3 | 77264.4819 | 289 | 0.0256 | 0.0001 |
| 4 | 58254.1312 | 163 | 0.0171 | 0.0001 |
| 5 | 86431.5633 | 164 | 0.0257 | 0.0002 |
| AVG | 78057.5791 | 203 | 0.0220 | 0.0001 |
| MED | 77264.4819 | 174 | 0.0256 | 0.0001 |
The tiny measured intervals in this table are timestamp overhead. They do not represent the model, network, rendering, or end-to-end processing time for each update.
The median total response fell from 84.77 seconds to 77.26 seconds, a difference of about 7.51 seconds. That comparison is not a controlled benchmark because the live model produced different responses and update counts. The direct result is simpler: removing the line removed the 9 to 12 seconds of application-added waiting measured in the baseline runs.
Remove the wait, not the stream
The profiler investigation worked only after it targeted the process that owned the code. AppHost was useful for orchestrating the agent and its dependencies, while the standalone Web UI gave Visual Studio an unambiguous profiling target.
CPU Usage then answered one part of the question: the captured response was not dominated by application CPU work. It could not expose the accumulated asynchronous wait, so a direct timer around Task.Delay(50) supplied the missing evidence.
The measurements do not support keeping an unconditional 50 ms delay on every update. The response still streams after the delay is removed. If the UI needs deliberate pacing, that behavior should be designed and measured separately rather than tying latency to the number of incoming updates.
One option is to consume updates immediately but coalesce UI refreshes. This example renders at most once every 50 ms and always flushes the final update:
// Limit UI refreshes to at most once every 50 ms without delaying stream consumption.
var renderInterval = TimeSpan.FromMilliseconds(50);
var lastRenderAt = Stopwatch.GetTimestamp();
var renderPending = false;
var textChanged = false;

try
{
    await foreach (var update in ChatClient.GetStreamingResponseAsync(
        outboundMessages,
        chatOptions,
        cancellationToken))
    {
        messages.AddMessages(update, filter: c => c is not TextContent);
        renderPending = true;

        if (update.Role == ChatRole.Assistant &&
            !string.IsNullOrEmpty(update.Text))
        {
            responseText.Text += update.Text;
            textChanged = true;
        }

        // Flush pending UI changes once the render interval has elapsed.
        if (Stopwatch.GetElapsedTime(lastRenderAt) < renderInterval)
        {
            continue;
        }

        FlushRender();
        lastRenderAt = Stopwatch.GetTimestamp();
    }
}
finally
{
    FlushRender();
}

void FlushRender()
{
    if (!renderPending)
    {
        return;
    }

    if (textChanged)
    {
        ChatMessageItem.NotifyChanged(responseMessage);
    }

    StateHasChanged();
    renderPending = false;
    textChanged = false;
}
Unlike Task.Delay(50), this does not pause each incoming update. Bursts are combined into fewer renders, while slower updates still appear as they arrive. The 50 ms refresh interval is a starting point, not a fixed recommendation; profile it with the expected stream rate and adjust it based on responsiveness and render cost. This coalesced version was not part of the measurements above, so it needs its own before-and-after run.
Fifty milliseconds looked cheap in isolation. Repeated across a real response, it became roughly 10 seconds of avoidable waiting.


0 comments