

Standardizing Dimensions: Completing the Unified Data Model
Introduction
A Unified Data Model is only as strong as the consistency of its dimensions. This article explains why standardizing dimensions is the critical final step in completing the Unified Data Model—and how it moves the platform from schema alignment to true analytical coherence.
By grounding dimensions in shared definitions, governed metadata, and reusable patterns, this work closes long-standing gaps that surface downstream as inconsistent metrics, fragile joins, and duplicated logic. The article walks through what dimension standardization really means in practice, how it fits into the broader Unified Data Modeling strategy, and why it is essential for scalable analytics, trustworthy insights, and AI-powered experiences like Copilot.
Readers will gain clarity on how standardized dimensions connect entities, facts, and measures into a cohesive model—and why this foundation is necessary to unlock interoperable, high-quality data across teams, products, and business scenarios.
The first four articles in this series introduced why a Unified Data Model (UDM) is necessary, how to build UDM-driven data assets, how to validate correctness to protect data quality and uptime, and how to embed scalable governance and compliance. This final article focuses on Dimensions—standardized, centrally managed lookup tables that provide shared categorical context for analysis. Dimensions are the missing piece that makes enterprise reporting comparable across teams, eliminates repeated mapping work, and enables apples-to-apples business conversations across products, stakeholders, and tools.
Figure 1. Dimensions complete the UDM pipeline by providing shared context for every consumption layer. 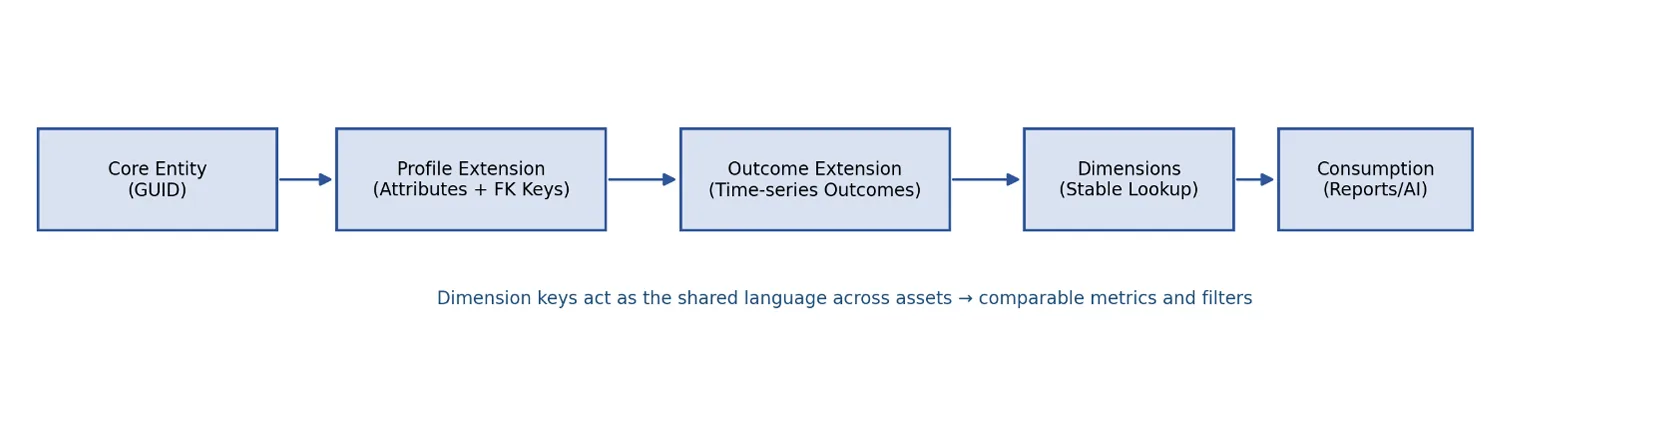
1. Background: From “Why UDM” to “Why Dimensions”
In Article 1, we described a familiar enterprise problem: teams model the same concepts in different ways, which makes discovery hard and standardization nearly impossible. UDM introduced common data shapes—Entities, Profiles, Extensions, Outcomes, and Dimensions—so teams can reuse definitions and build on a shared semantic layer.
But there’s a subtle truth many organizations discover late: even after you standardize entity IDs and build reusable extensions, your insights still won’t be comparable if your categorical values (geo, segment, platform, channel, etc.) are inconsistent. Dimensions solve that last-mile problem by ensuring the categories used for filters and group-bys are identical everywhere.
2. What is a Dimension in UDM?
A Dimension is a controlled table of descriptive values—names, categories, or types—that provide context to your measures. Dimensions are typically stable, change slowly, and are referenced via keys (foreign keys) from Profiles, Extensions, and Outcomes. This design prevents free-text drift (e.g., “US” vs “United States”) and keeps reporting and analytics consistent.
Dimensions appear in dashboards and reporting tools as slicers, filters, and group-by fields. When Dimensions are standardized, all consumers interpret categories the same way—no translation layers or bespoke mapping tables needed.
Figure 2. Standard Dimension keys eliminate category drift and mapping overhead.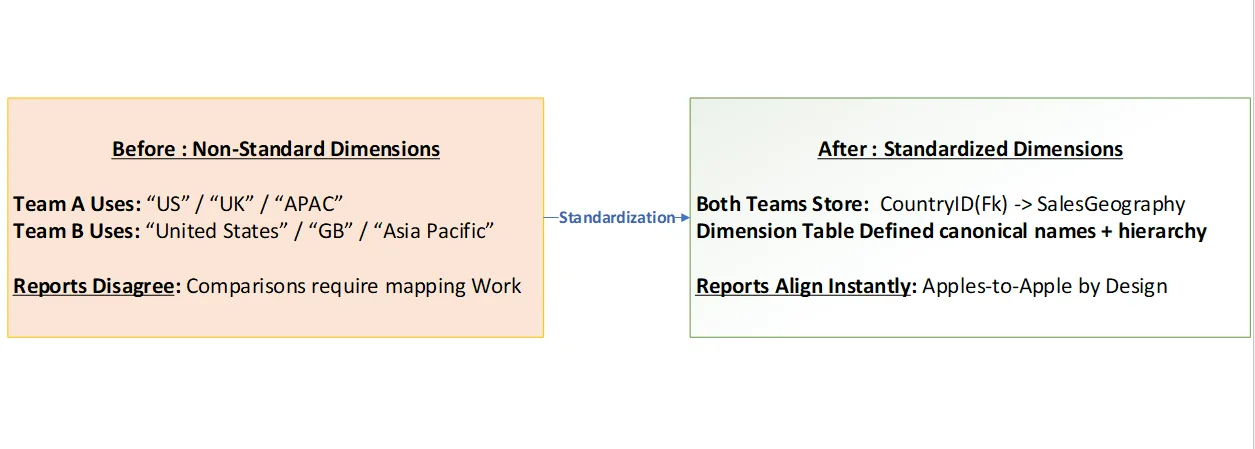
3. Concrete Scenarios: How Standard Dimensions unlock “apples-to-apples” insights
Scenario A – Comparable reporting across teams (Geo hierarchy)
Imagine two product teams publish tenant-level adoption dashboards. Both include geography, but one uses ISO codes and the other uses region names derived from internal logic. When leadership asks, “How are we doing in Europe?”, the answers differ—not because the business differs, but because the category definitions do.
With UDM, both teams store CountryID (or GeoKey) in their extensions and join it to a shared dimension such as SalesGeography. The dimension centrally defines Area, Region, Country, and rollups. Reporting tools now slice consistently.
Example query (pseudo-SQL):
-- Example: adoption by standardized geo
SELECT g.AreaName, g.RegionName, COUNT(DISTINCT t.TenantId) AS ActiveTenants
FROM TenantOutcome o
JOIN TenantProfile t ON o.TenantId = t.TenantId
JOIN SalesGeography g ON t.CountryId = g.CountryId
WHERE o.OutcomeName = 'TeamsActivated'
GROUP BY g.AreaName, g.RegionName;
Scenario B – Metric consistency across data products (Seat-size buckets)
Organizations frequently segment customers by size. But if every metric defines “seat size buckets” differently, your KPIs won’t line up. UDM addresses this by standardizing bucket logic into a Dimension (e.g., PaidSeatSizeBucket).
Once the seat-size bucket is a shared dimension, every metric and report that needs size-based segmentation uses the same key. This enables consistent slices across Paid Seats, lifecycle outcomes, and subscription analytics—without repeatedly re-implementing bucketing logic.
Scenario C – Multi-stakeholder consumption (Segment + Industry)
Finance, sales operations, and product teams often analyze the same customers but with different lenses. If each stakeholder uses their own segment and industry lists, cross-team reviews become debates about mapping rather than business action.
By using standardized dimensions such as CustomerSegmentGroup and IndustrySummary, the organization establishes a single interpretation of segment and industry categories. Downstream semantic models and dashboards can join these dimensions uniformly and publish consistent KPIs.
Figure 3. Dimensions keep every consumption layer aligned—from UDM assets to semantic models and reporting tools. 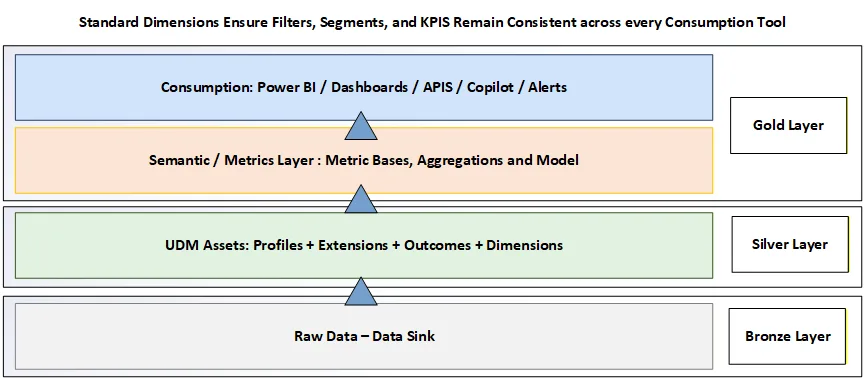
4. Benefits Summary: What standard Dimensions deliver
| Benefit | What it fixes | How Dimensions deliver | Concrete example |
|---|---|---|---|
| Consistency | Different teams label the same category differently | Foreign keys reference one canonical dimension table | SalesGeography (CountryID → Area/Region) |
| Comparability | Dashboards cannot be compared without mapping | Same keys drive identical filters and group-bys everywhere | CustomerSegmentGroup (SegmentKey) |
| Governance | Category updates require many pipeline changes | Update the dimension once; downstream joins automatically reflect it | Language (LanguageKey) |
| Quality & Validation | Bad values break joins or silently skew metrics | Referential integrity checks ensure all keys exist in the dimension | CountryId must exist in Country dimension |
| Scalability | New products re-create the same categories repeatedly | New assets re-use existing dimensions and stay aligned | BillingCycle / UpstreamSource |
5. Why Standardizing Dimensions Is Critical
Standardizing dimensions – meaning using a common set of agreed-upon categories and keys across all data sources – is essential to achieve consistent, comparable insights in large or mid-sized companies.
In practice, telemetry and product usage data collected by different teams often encode categories (like region, customer type, product, etc.) in slightly different ways, leading to fractured taxonomies. For example, one team might label a geographic field as “NA/EU/APAC” while another uses “Americas/EMEA/Asia,” so their reports can’t be directly compared without extra mapping. Standard dimensions solve this problem by ensuring these categories use the same definitions and keys everywhere, enabling truly apples-to-apples comparisons of metrics across teams and products.
When dimensions are standardized, all data assets reference a single source of truth for categorical information. Instead of embedding free-form labels in each dataset (which can diverge, e.g. using “USA” in one place and “United States” in another), systems store standardized dimension keys that point to a centrally managed lookup table. This alignment delivers immediate benefits:
- Consistent Reporting: Everyone uses the same geography codes, customer segments, subscription categories, etc., so dashboards and queries automatically align without manual reconciliation.
- Comparable Metrics: Key performance indicators (KPIs) become comparable across products or teams because filters and groupings refer to identical categories (no more contradictory answers for “How are we doing in Europe?”).
- No Redundant Mapping: Analysts and data engineers no longer need to maintain custom mapping tables between different taxonomies – the standard dimension is the mapping that everyone shares.
- Simplified Governance: Updates to categories can be handled in one place. If a region splits or a new product category is added, changing the central dimension table automatically propagates to all downstream data uses, rather than requiring multiple pipeline changes.
- Quality Control: With standardized dimensions, referential integrity checks can ensure every data record’s category key is valid (exists in the dimension). This prevents “unknown” values from silently skewing analyses.
In short, standardized dimensions provide the shared language for data. They are the glue that connects core entities and metrics into a cohesive model, allowing insights drawn from disparate sources to be unified and trustworthy.
Real-World Examples Across Microsoft’s Data
To illustrate, consider Microsoft’s commercial data context (customers, tenants, subscriptions, product usage):
- Geography (Tenant Region): Imagine two product teams each track tenant adoption, but one logs geo by ISO country code, while another uses internal region names. Without standardization, leadership might get conflicting answers if they ask “How are we doing in Europe?” – not because the metrics differ, but because the category definitions do. By standardizing on a common Geo dimension (e.g. using a shared CountryID or GeoKey mapped to a central SalesGeography table for Area/Region/Country), both teams’ data roll up into the same hierarchy. Queries now use a single region definition, yielding a consistent view of tenant metrics by region.
- Customer Size Buckets (Subscription/Seat Segmentation): Different products often segment customers by size (e.g. small, medium, large), but if each defines the bucket thresholds differently, their “Large Customer” metrics can’t align. By introducing a standard dimension for seat-size buckets (for example, PaidSeatSizeBucket with uniform ranges for subscription seat counts), all teams use the same bucket definitions for analyzing subscription and usage data. This ensures consistent segmentation across telemetry, customer lifecycle, and subscription analytics without reinventing the logic in each pipeline.
- Customer Segment & Industry: Sales, finance, and product teams might each classify customers (tenants or accounts) by segment or industry with their own lists. This leads to debates about mappings instead of focusing on insights. Standard dimensions like CustomerSegmentGroup (for customer segment categories) and IndustrySummary (for industry categories) establish one agreed-upon classification across the organization. When all data sources attach these keys to their records (e.g., each Tenant’s data carries a SegmentKey and IndustryKey referencing those dimensions), any cross-team reporting or AI analysis will use a single consistent segment/industry lens.
These scenarios highlight how standard dimensions unlock apples-to-apples insights. Without them, metrics need manual alignment; with them, shared keys do the heavy lifting and metrics naturally compare on equal footing.
6. The Role of UDM and Data Contracts
At Microsoft, the Unified Data Model (UDM) initiative formalizes this approach. UDM defines core entities (like Tenant, User, Subscription) and attaches dimensions as part of an “‘uber’ entity-level data contract.” This means that for each core entity profile and its extensions, the key categorical fields are defined by reference to standard dimensions under a governed schema. In practice, UDM ensures that any telemetry or business data onboards into a common shape: core IDs for entities, plus standard dimension keys for categoricals. By doing so, it reduces the complexity of joining data across teams – if everyone uses the same entity IDs and dimension keys, combining data sources is straightforward and doesn’t require custom reconciliation. Essentially, the UDM’s data contract guarantees that a Tenant from one dataset can be joined to a Tenant in another dataset on the same ID, and any grouping (by region, segment, etc.) will use the same standardized keys and definitions across the board.
Moreover, when new data is onboarded, UDM’s governance process checks for conformity. For example, if a team wants to add a new extension on a core entity with a categorical attribute, they either must use an existing standard dimension or collaborate to extend the dimension – rather than introduce a one-off field. This collaborative contract approach prevents divergent taxonomies from proliferating, thereby locking in consistency from the ground up.
Best Practices for Dimension Standardization
To successfully map and transform diverse data to a common set of standard dimensions, consider the following best practices:
| Best Practice | Guidance & Rationale |
|---|---|
| Reuse existing dimensions | Before creating any new categorical field, see if a standard dimension already exists (e.g. Country, Industry) and use it. Avoid duplicating or reinventing categories! |
| Store keys, not labels | In your core entity profiles or fact tables, store only the foreign key (e.g. a CountryID or SegmentKey), not free-text names. This prevents drift (no “US” vs “United States” inconsistency) and ties data to governed values |
| Join to dimension at query time | Fetch descriptive labels and hierarchies by joining with the dimension table when querying or building a semantic model. This way, any updates to dimension values automatically reflect everywhere without altering raw data. |
| Implement mapping and validation | Use mapping tables or transformation logic during ingestion to convert source-specific codes to standard dimension keys. Introduce validation checks so that every key in your data exists in the corresponding dimension (catching any unmapped or new category) |
| Document and govern dimension usage | Clearly document which standard dimensions each data asset uses as part of its data contract. Handle changes through a governed process (e.g. review new dimension values via a central stewardship) so that standard definitions remain stable and widely accepted. |
By following these guidelines, a “smart” data platform can automate much of the heavy lifting — e.g. detect new raw values and map them to the appropriate standard category, or alert when a dataset isn’t using an approved dimension. Ultimately, mapping data to common dimensions is a one-time investment that yields ongoing dividends: it streamlines data integration across sources, ensures that insights and AI models are built on consistent foundations, and makes cross-team analysis far easier and more credible.
In summary, dimension standardization is critical for any organization aspiring to unified, reliable analytics. It transforms a collection of siloed data sources into a coherent whole by giving everyone the same frame of reference. In conjunction with a Unified Data Model and strict data contracts, it forms the backbone for scalable analytics and a shared “data language” across the company. Only when dimensions are standardized can core entities and metrics truly be aggregated and compared with confidence, enabling deeper insights and smoother decision-making.
7. Pulling it all together: How Dimensions “Unlock” the whole UDM story
Article 1 argued that UDM is necessary because consistency and discoverability collapse in siloed data environments. Dimensions operationalize that promise by standardizing the categories that sit behind every slicer and filter in a report—making data truly reusable.
Article 2 showed how to model a Profile and Extension and normalize a free-text attribute into a Dimension (Country). That pattern scales to dozens of enterprise categories—geo, segment, product, channel, lifecycle stage, and more.
Article 3 emphasized correctness through validation. Dimensions make validation easier and more powerful: a single referential integrity check ensures every extension uses valid keys, preventing category drift from contaminating downstream metrics.
Article 4 focused on governance and compliance. Centralized dimension ownership supports controlled change management, auditability, and standard naming—and reduces rework when policies or classifications evolve.
8. Practical guidance: How to adopt standard Dimensions
When building or refactoring UDM assets, follow these steps:
-
Start by checking if a standard dimension already exists for your category (avoid duplication).
-
Store only the foreign key (e.g., CountryID, SegmentKey) in your extension; avoid free-text categorical columns.
-
Join to dimensions at query or model time to retrieve labels and hierarchies.
-
Add validation rules to guarantee every foreign key maps to a valid dimension row.
-
Document the dimension(s) your asset depends on in metadata and contract documentation.
9. Conclusion: Dimensions turn UDM into a shared language
In large organizations, the difference between “data exists” and “data is useful” is often the ability to compare and align. Standard Dimensions create that alignment. They eliminate category drift, reduce mapping overhead, strengthen validation and governance, and make enterprise reporting truly apples-to-apples. If Core Entities are the nouns and Outcomes are the verbs of your data model, Dimensions are the shared adjectives that make every story comparable.
10. References:
- Unified Data Model at Microsoft – Why a Unified Data Model is Critical: Lessons from Building Microsoft’s Semantic Layer,
- Leveraging the Unified Data Model: A Practical Example of Data Modeling – Unified Data Model at Microsoft
- Validations and Correctness: How UDM enables Devs to build for Data Quality, Uptime, and Velocity – Unified Data Model at Microsoft
- Scalable Data Governance & Compliance with UDM – Unified Data Model at Microsoft
0 comments