What do your users really think? Using Text Analytics to understand GitHub Issue Sentiment
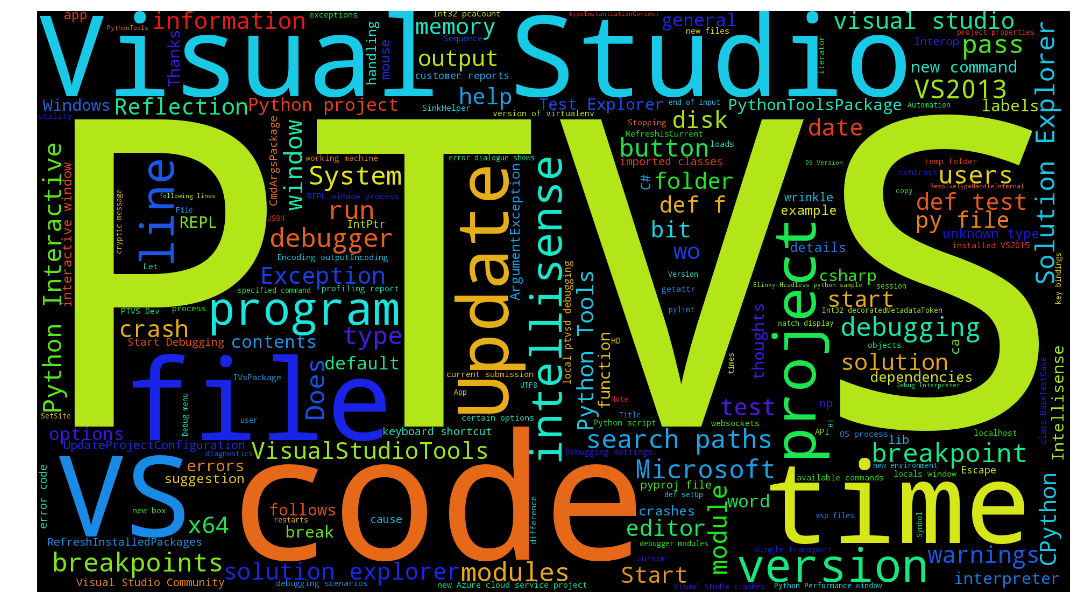
Ever get the feeling your users aren’t that happy with your project? We all get those issues that are real downers on our repository. So I thought, let’s take these issues and make something fun. Using the Text Analytics Service and the WordCloud Python package, we can make some pretty pictures out of otherwise negative comments. I also found it fun to make clouds of the more positive issues.
Below you will find a few snippets on how to do this yourself. If you want to just run this against your favorite GitHub project you can open a Jupyter notebook using the notebook link above. The below code is shown just to give you an idea of what the notebook does. In order to make it function you would need to complete a few additional bits of code.
Step 1: Install some libraries
We use a few libraries and should start by installing them. CortanaAnalytics is a small library to wrap requests to Azure Data Market Services. PyGitHub serves a similar purpose for GitHub. WordCloud helps to make pretty pictures.
pip install CortanaAnalytics
pip install PyGitHub
pip install wordcloud
Step 2: Get API keys to access Azure Text Analytics and GitHub
We need two API keys so we can access some services.
You can get an account key for the Text Analytics Service by signing up at http://azure.microsoft.com/en-us/marketplace/partners/amla/text-analytics You can get a GitHub API Key by creating a token at https://github.com/settings/tokens.
Step 3: Get some issues from GitHub
Once you have API Keys, you just need to get GitHub issues.
import github

g = github.Github(GITHUB_ACCESS_TOKEN)
r = g.get_repo(GITHUB_REPOSITORY)
issues = r.get_issues(state='open')
Step 4: Analyse an issue using the Text Analytics Service
Once you have the GitHub issues we can iterate on them arranging them into text bits that can be analysed by Text Analytics. We will batch Sentiment requests together for the issue to cut down on the overall number of requests.
from cortanaanalytics.textanalytics import TextAnalytics
text_bits_to_analyse = [
    { 'Id':0, 'Text':issue.title },
    { 'Id':1, 'Text':issue.body }
]

ta = TextAnalytics(AZURE_PRIMARY_ACCOUNT_KEY)
sentiments = ta.get_sentiment_batch(text_bits_to_analyse)

title_sentiment = sentiments[0]['Score']
body_sentiment = sentiments[1]['Score']
Step 5: Get Key Phrases
We can also get key phrases using the same issues we used for sentiment.
key_phrases = ta.get_key_phrases_batch([{ 'Id':i.number, 'Text':i.body }])[0]['KeyPhrases']
Step 6: Generate some pretty pictures of our data using WordCloud And once we have all of that, we can go ahead and make word clouds.
from wordcloud import WordCloud
import matplotlib.pyplot as plt

def show_wordcloud(frequencies):
    frequencies_cleaned = [x for x in frequencies if x[0].lower() not in words_to_remove]

    wordcloud = WordCloud(width=1920, height=1080).generate_from_frequencies(frequencies_cleaned)
    plt.axis("off")
    plt.imshow(wordcloud)

show_wordcloud(key_phrases)
And that’s it. You can try to reproduce this on your own locally or run the notebook and experiment from the Azure Notebooks environment.


 Light
Light Dark
Dark
0 comments