

We’ve recently released a new tool called SizeBench, which helps investigate binary size for compiled native PE files such as DLLs and EXEs. This post will talk a bit about what the tool can do and how we’ve used it inside Microsoft over the past few years as it has been developed.
You can download the tool now from the Microsoft Store – just click here to get started: https://aka.ms/SizeBench
Table of Contents
- Why care about binary size?
- What can SizeBench do?
- Looking at an example – Windows Terminal
- Heuristic Analyses
- Wasteful Virtuals
- Duplicate Data
- Template Foldability
- But Wait, There’s More!
- Notable Limitations
- Some Fun History, and How We’ve Used This at Microsoft
- Feedback
Why care about binary size?
There’s a lot of ways to spend time when developing an app – adding features, optimizing various metrics like CPU usage or memory, the amount of battery draw, and more. So why care about size, especially size of binaries? After all, storage sizes today are often huge and apps have images and databases and other files that can at times dwarf the size of the compiled binaries. It’s a good question.
Binary size impacts several things – the time to download and install an app or update, the time it takes to load all the file pages off disk into memory, the amount of memory used when a process loads that binary, and of course the disk footprint of the installed app.
Many people still have a spinning hard disk, which can have significant latency in fetching pages into memory. In the long tail of users, reducing disk I/O can sometimes surpass even significant CPU wins in an app’s startup path, and having smaller binaries means you likely load less off the disk to get to that critical first frame where a user can begin interacting.
What can SizeBench do?
Lots of things! SizeBench is a static analysis tool that looks at a binary and helps you understand what it’s composed of and where you might be able to shrink things. Functionality is broken up into two broad categories – factual reporting of what’s in a binary, and heuristic analyses that look for likely causes of waste. We’ll start by talking about “just the facts” but stick around for the heuristic analyses later in this post, they’re super cool.
The key question SizeBench tries to help with is this: you typed in a bunch of code that helps your product do what you wanted functionally, but how do you know which code produces a lot of bytes on disk and which does not? It’s very difficult to have any intuition here, because of things like function inlining, compiler optimizations that happen in Release mode, linker dead code removal, COMDAT folding, Profile-Guided Optimization…there’s just so many transformations that happen to your code from when you type it into your text editor vs. when it’s a finished binary that you ship that it’s impractical to figure out which code is resulting in bytes on disk without a tool like this.
A classic example of where the number of lines of code you type in doesn’t have an obvious relationship to binary size is C++ templates. You can write a template in a few lines of code, then end up instantiating it for lots and lots of types, and suddenly generate hundreds or thousands of near-identical copies of the code into your binary. More on how SizeBench can help with that that specific problem later!
Looking at an example – Windows Terminal
Let’s walk through an example of using SizeBench by using Windows Terminal as a convenient way to illustrate all the functionality – Terminal is open source, so you can follow along at home. Just clone the Windows Terminal repo, and checkout commit 4f6f3b98 to see things as they are throughout this post.
Follow the steps in the repo readme to get your Visual Studio configured appropriately, then open OpenConsole.sln. Set the Solution Platform to x64, Solution Configuration to Release, and then Build the Solution.
Open SizeBench and let’s get started – you should see this:
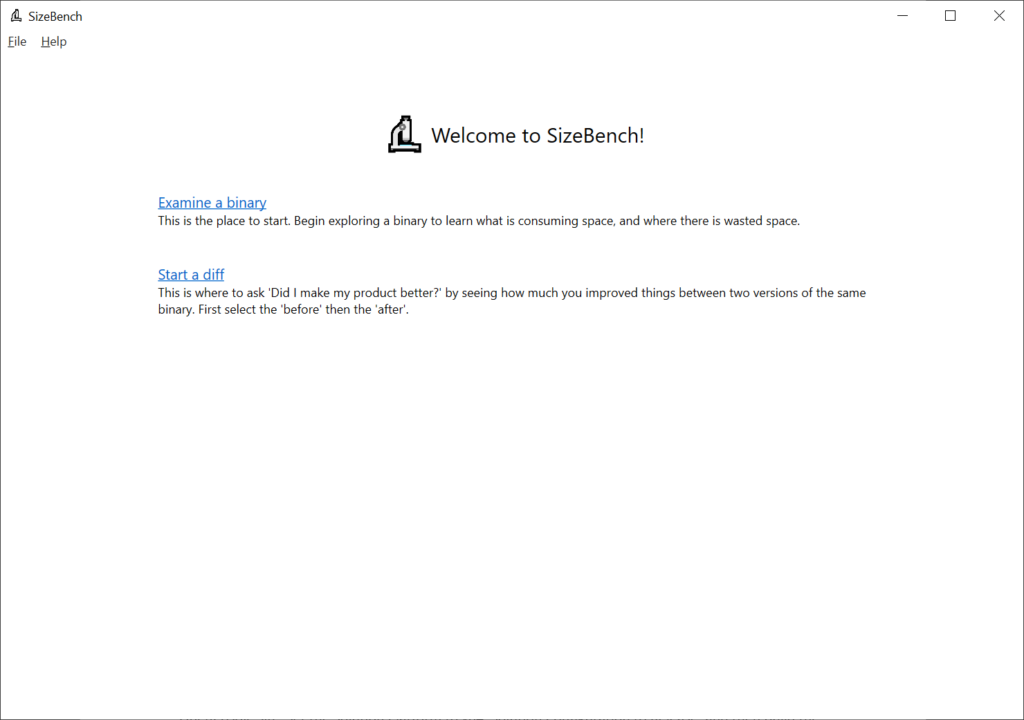
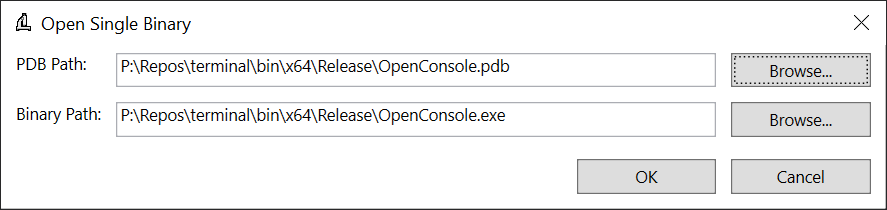
It’s possible to take two versions of a binary and diff between them, which can be very helpful to understand growth across releases or things like that – but for now we’ll just click on “Examine a binary” to look at one of the outputs from Terminal – in the dialog that pops up, as a pro tip if you select the PDB file first SizeBench will try to infer where the binary is, this works well if they’re side-by-side like they often are. We’ll select these files:
You’ll be greeted with this screen:
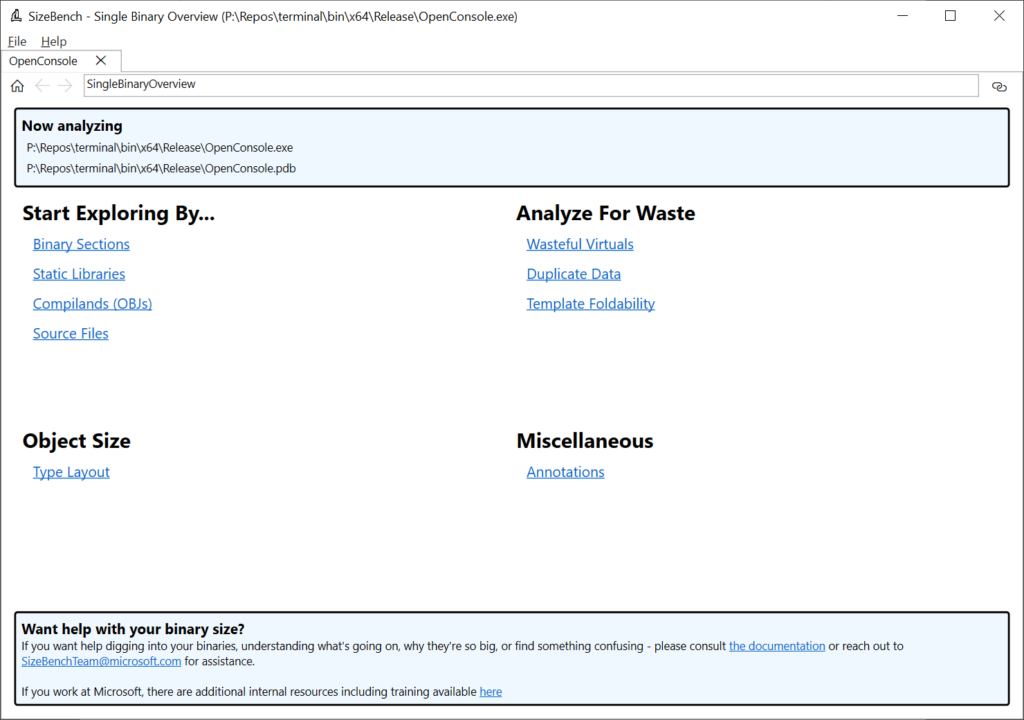
Let’s start exploring by Binary Sections by clicking on that link near the upper-left of the tab. Sections tell the OS loader how to map those pages into memory, such as whether they are executable or not, whether they are read-only or read-write, and so on. These have rather cryptic names like “.text” or “.rdata” which SizeBench can help you decode into more helpful descriptions and are very broad buckets – in the case of OpenConsole.exe, they look like this:
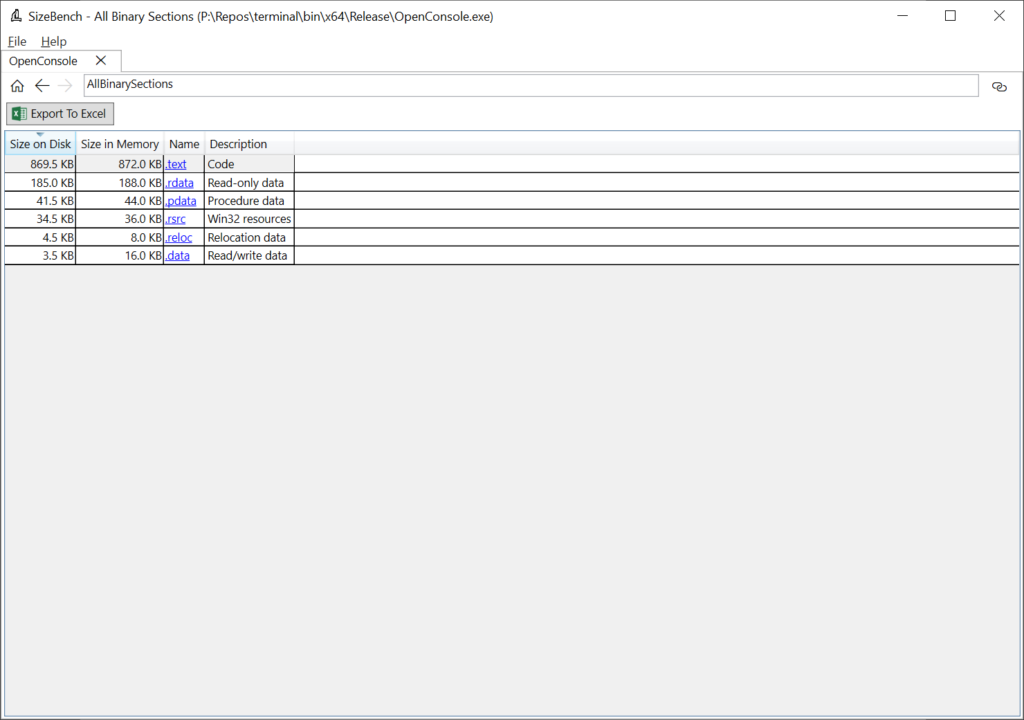
This shows that “.text”, which is code, is 869.5 KB on-disk and takes up 872 KB once loaded into memory due to rounding up to the nearest page size. “.rdata” or read-only data is next up weighing in at 185 KB, and so on.
If you click on one of these, like .text, you can drill-in to the next level of detail:
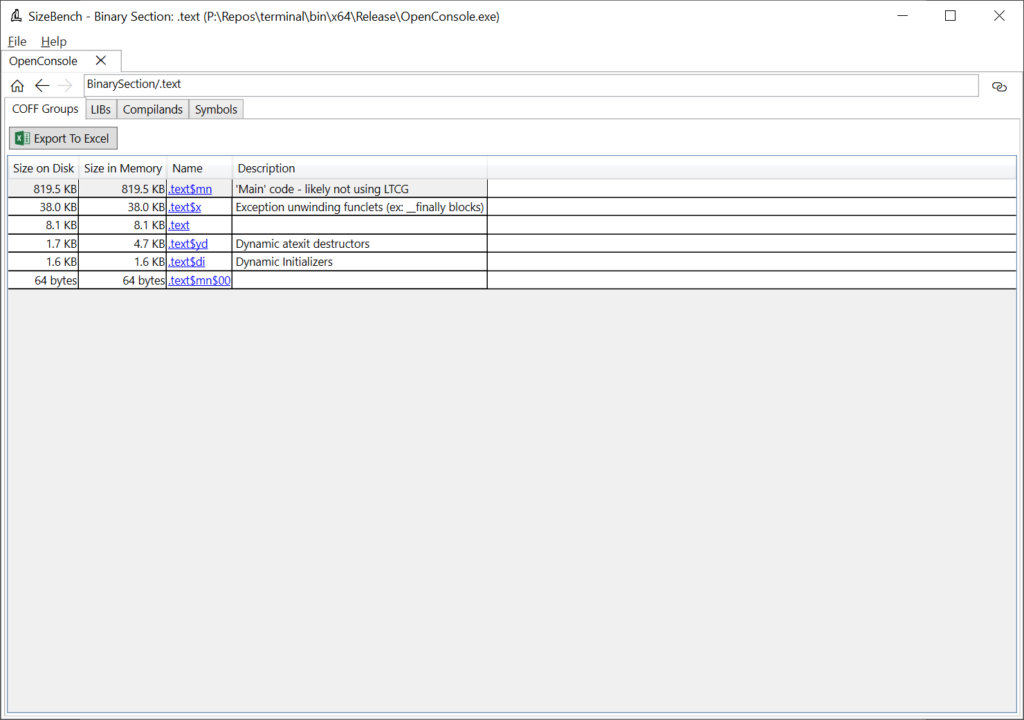
Here we can see that the “.text” section is broken up further into several smaller chunks called “COFF Groups.” These are a little bit finer grained, with more descriptive names and semantics. For example, we can see that the “.text$x” COFF Group contains exception unwinding funclets and is 38 KB. In large binaries, COFF Groups can still be somewhat coarse but it’s a start.
Let’s click on the “LIBs” tab of this .text section to see a bit more detail:
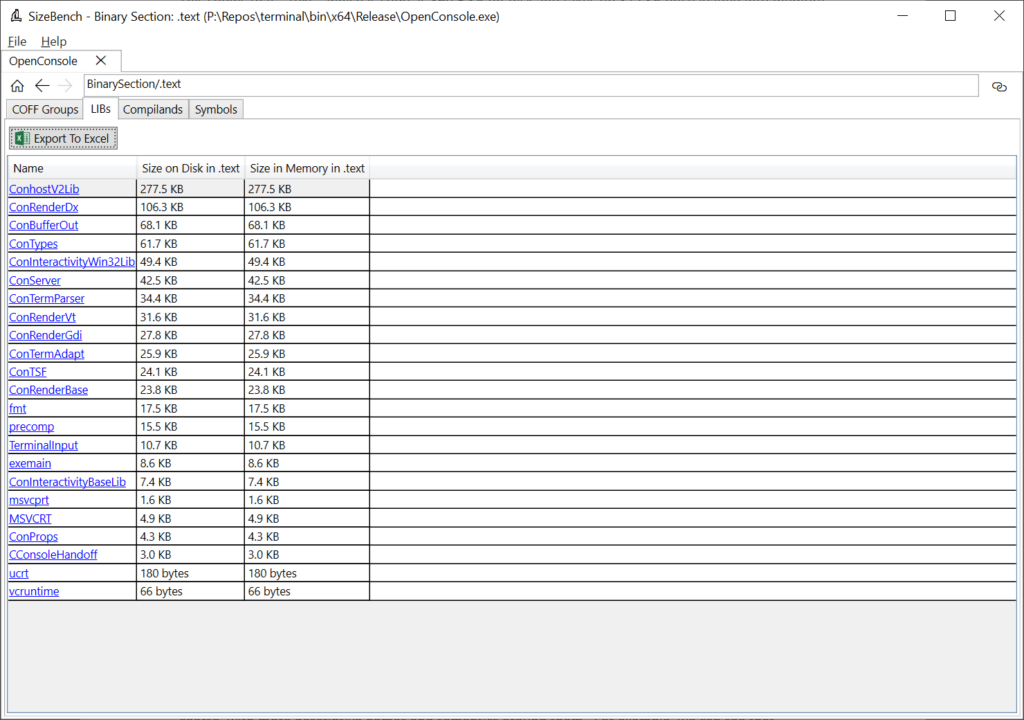
There are quite a few libs linked into this binary, but now we can see that of the 869 KB in .text, 277.5 KB of it comes from ConhostV2Lib.lib. In contrast, ConTermParser.lib is only 34.4 KB – so if we wanted to reduce the size of the binary, this can help narrow our focus to the biggest things to avoid spending time digging into small things.
What’s important to note is that this isn’t the size of the .lib file on-disk as you would see it in your obj folder. Rather, this is how much that lib contributed to this final binary that was produced, after all the optimizations the toolchain goes through.
The Compilands tab is similar, but it breaks the section down by OBJ file, and lastly on this page the Symbols tab shows all the symbols in “.text”.
For now, let’s click on the “ConhostV2Lib.lib” on this LIBs tab and see where it takes us:
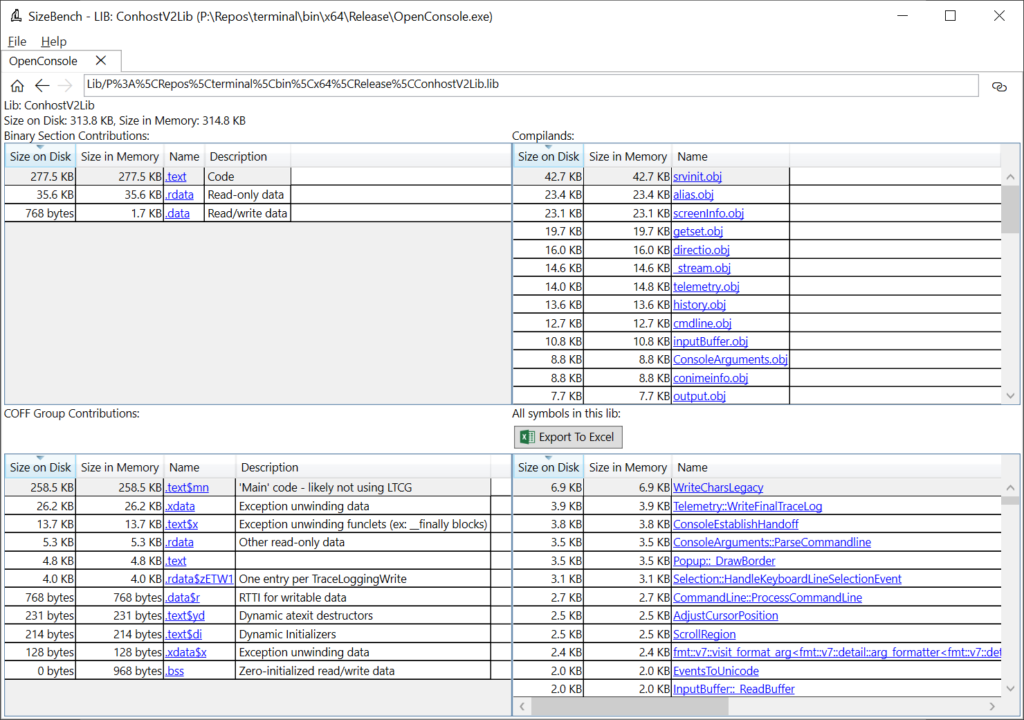
This is a bit of an eye chart showing an overview of the entire ConhostV2Lib static library and what it contributes to the binary. Let’s walk through it one quadrant at a time.
In the upper-left we can see the 277.5 KB of code we just saw previously but we can also see that this lib contributes 35.6 KB to “.rdata” and 768 bytes to “.data”.
In the upper-right this lib gets broken down into the obj files that are inside of it – a static lib is basically just a collection of OBJs in one file. So, within this lib srvinit.obj contributes the most at 42.7 KB, alias.obj is next at 23.4 KB, and so on.
In the lower-left we see how this lib contributes to various COFF Groups, and in the lower-right is every symbol in this static lib (whether code, data, or whatever). In this case, “WriteCharsLegacy” is the biggest symbol at 6.9 KB.
Let’s click on WriteCharsLegacy in that lower-right and see what shows up:
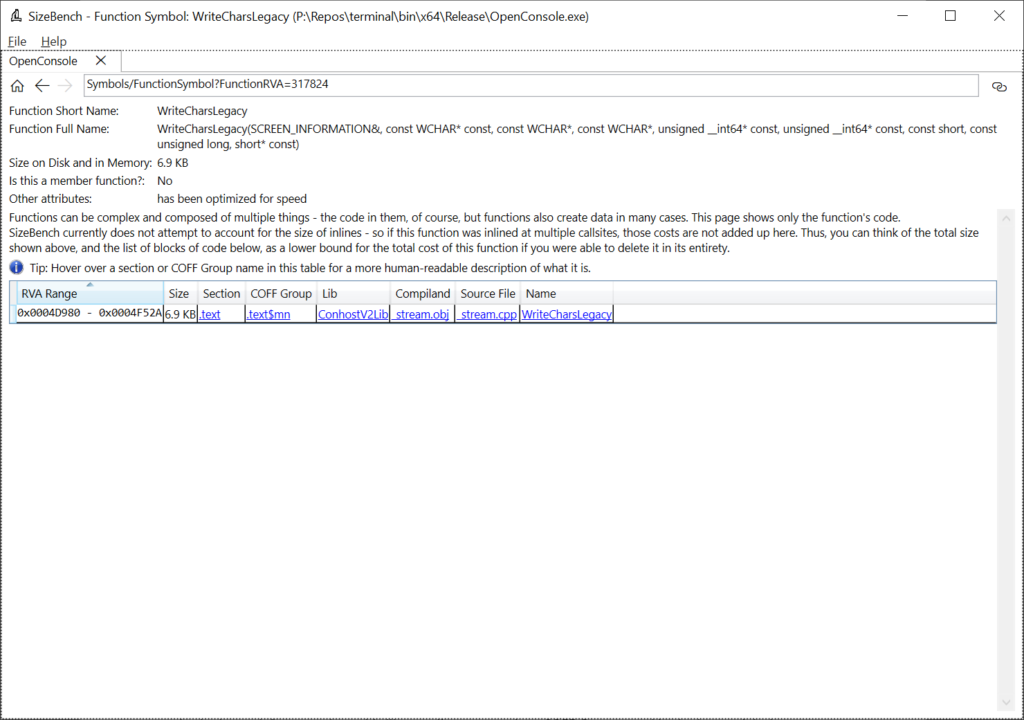
This turns out to be a function. The full signature is shown in case this might be an overload, so you know which one to look at in the source code. This function says under “Other attributes” that it has been optimized for speed (instead of for size, for example) and we can see the exact memory address in the binary that this code is in (0x4D980 – 0x4F52A). If this function had been processed by advanced tools like PGO, it may have multiple blocks of code separated across different parts of the binary, even across multiple COFF Groups. We can even see what source file it came form – in this case it is _stream.cpp.
I won’t walk through every screen of SizeBench, but this gives you an idea of how to navigate around. You just keep clicking on things to sort of ‘wander around’ your binary and understand more about how it really came together. You might be surprised at what you find – I know I was the first time I went looking at stuff my team made.
You can always hit the ‘Home’ button in the upper-left to jump back to the starting screen, or the back arrow to go back one page. You can also have multiple binaries open in different tabs if you want to jump around analyzing a larger multi-binary product.
Let’s say that WriteCharsLegacy was super interesting, and you want to talk to a coworker about it and have them open SizeBench up to see what you saw – you could instruct them on how to load the binary, what to click on as we did above, just to get to this function, but that’s tedious. Instead, you can click on the “deep link” button in the upper-right of the app to get a link to share with someone else. Note that it’s up to you to keep the binary and PDB in a location you can both access, like a network share for example.
Heuristic Analyses
It’s great that SizeBench can show a bunch of data like the examples above, but it can be overwhelming and sometimes you just want to know about opportunities to improve without understanding binaries in-depth. This is where the heuristic analyses in SizeBench come into play – these are all grouped under the heading “Analyze For Waste” and we’ll cover all three.
Each of these heuristics has a more detailed explanation that you can consult within the in-app help if you want all the specifics.
Wasteful Virtuals
Virtual functions are a very useful tool for enabling polymorphic behavior at runtime, but they can have some costs that are surprising and unnecessary. When a function is declared as virtual, it creates a slot in a vtable, which gets stored in the binary. This slot is quite small and normally not of concern for size purposes – but if you have a large hierarchy of derived types and they are unable to share their vtables (due to overrides), then you end up paying for that slot in not only the type that introduced the virtual, but across a whole family of types. In large codebases with big type hierarchies and lots of virtual functions this can add up quite a bit.
This gets especially interesting if that vtable slot isn’t giving you much value. SizeBench looks for two types of virtual functions that are wasteful – a virtual with no overrides, and a pure virtual with exactly one override.
If a function is declared as virtual but then never has any overrides down the type hierarchy, you pay for the slot in a lot of vtables, but you don’t ever benefit from the polymorphism. This happens surprisingly often in large, older codebases that may have once had overrides but as the code has changed over time it no longer takes advantage of the virtual-ness. By devirtualizing the function you not only save binary size, you also make each call direct. Direct calls are easier for the compiler to optimize with mechanisms like inlining and direct calls don’t need to have code emitted at each call site for security measures that are important for indirect calls like Control Flow Guard.
Another kind of virtual that is wasteful is a pure virtual function (“ = 0” in C++) which has just one override throughout the whole type hierarchy. In this case you are again paying for all the virtual dispatch and vtable slots, CFG checks, etc., yet only ever calling one copy anyway so it’d be nice to devirtualize it and just directly call the one implementation.
If we click on Wasteful Virtuals in this OpenConsole.exe example, we see this:
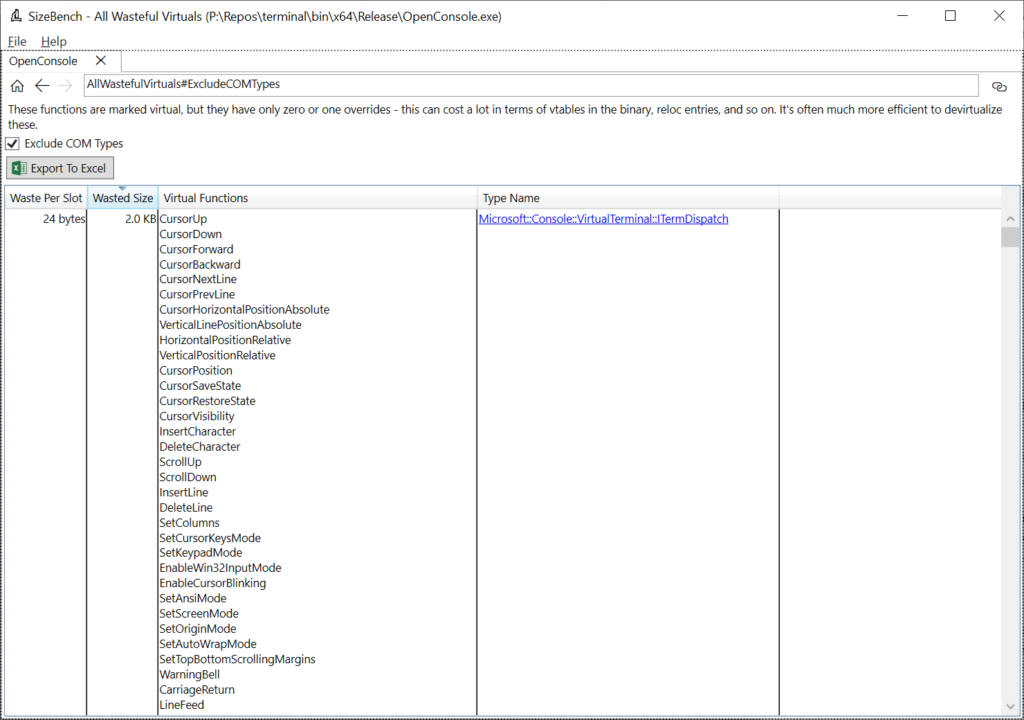
What this is showing is that the ITermDispatch type has a whole lot of virtual functions on it that fit one of these two categories – they’re either virtual with no overrides, or pure virtual with one override.
Each of these virtual functions only wastes 24 bytes in the binary because there’s not many derived types, but collectively there are so many that it adds up to 2 KB of binary size that could be reclaimed by changing how these are implemented – not to mention the possible CPU benefits of doing more direct calls.
Scrolling down the list you can see other types, and if you click on one of the types, you’ll get a little more information about the functions detected as wasteful. The documentation goes into examples of how you can try to devirtualize these.
This may sound small, and indeed in this example it’s quite small at only a handful of kilobytes – but in some larger codebases we’ve been able to use this analysis to reduce a lot. In the Windows.UI.Xaml.dll binary in Windows we saved over 1MB of size by iterating a little bit on wasteful virtuals due to some bad patterns that got copied around the codebase.
Duplicate Data
Sometimes the same data gets put into a binary repeatedly. With strings, this happens so often that the compiler even has a special flag for it (/GF). It is rather easy to accidentally duplicate data, sometimes including large arrays that really add up.
This happens most often when something is marked as ‘static const’ which creates a copy in each translation unit that references the data. Instead you can use constexpr if you are on newer C++ versions, or ‘extern __declspec(selectany) const’. Looking in OpenConsole.exe we see this:
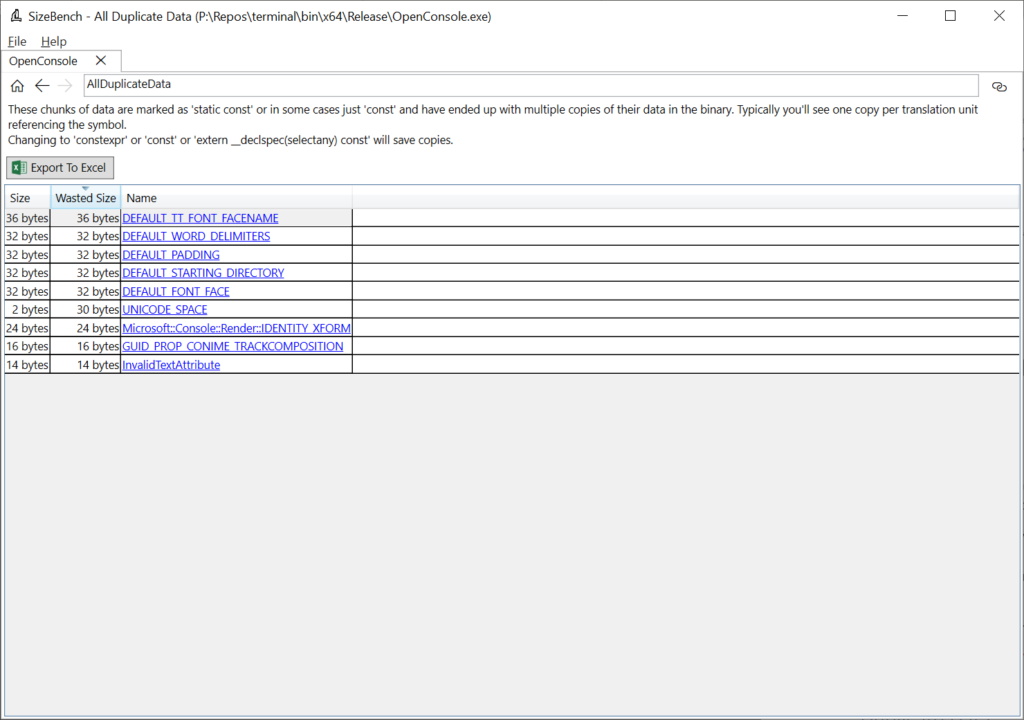
This binary does a good job at not having much duplicate data. But let’s click on DEFAULT_TT_FONT_FACENAME to see an example anyway, even though it’s a mere 36 bytes wasted in this case:
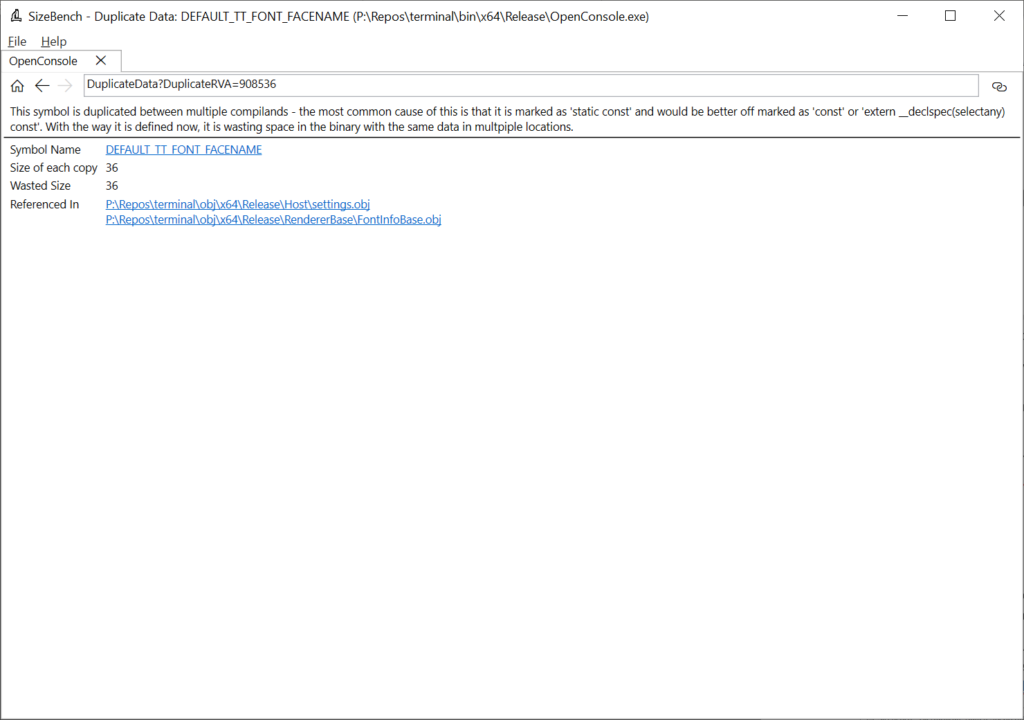
This shows that two translation units are producing duplicate copies of this data – settings.obj and FontInfoBase.obj. Looking at this code in the Windows Terminal codebase, it’s a string defined like so:
#define DEFAULT_TT_FONT_FACENAME L”__DefaultTTFont__”
What this suggests to me is that this binary isn’t using the /GF compiler option to fold strings, that would be a quick fix here and would ensure any future strings added are also folded.
Again, this example is small, and you may wonder if this really matters – we used this analysis on the code for the Windows Start Menu a couple years back and found we could reduce the entire binary by 10% by de-duplicating some data.
Template Foldability
The heuristic analysis that is probably the coolest and most fun is Template Foldability. The observation is that it’s common to see a template in C++ get expanded numerous times in a codebase, and each expansion may be very, very similar but not 100% identical to each other when you get down to the bytes of assembly code emitted. When the linker comes through later and uses the Identical COMDAT Folding optimization (/OPT:ICF) it is only able to fold together things that are 100% identical, so these nearly-identical copies remain.
Thus, it’s super easy to end up with dozens or hundreds of copies of code that is 90% the same bytes of assembly. In a templated function that is of even modest length this adds up to a lot of duplicated code. SizeBench’s Template Foldability analysis can look through the binary for templates that have instantiations like this and estimate how similar they are and how much you could save by tweaking their implementations to be truly folded together.
OpenConsole.exe doesn’t have a great example of this, so here we’ll switch to looking at a different binary called Microsoft.Terminal.Settings.Model.dll, also located in the bin folder for Windows Terminal. After opening that binary in SizeBench and clicking on Template Foldability, we see this:
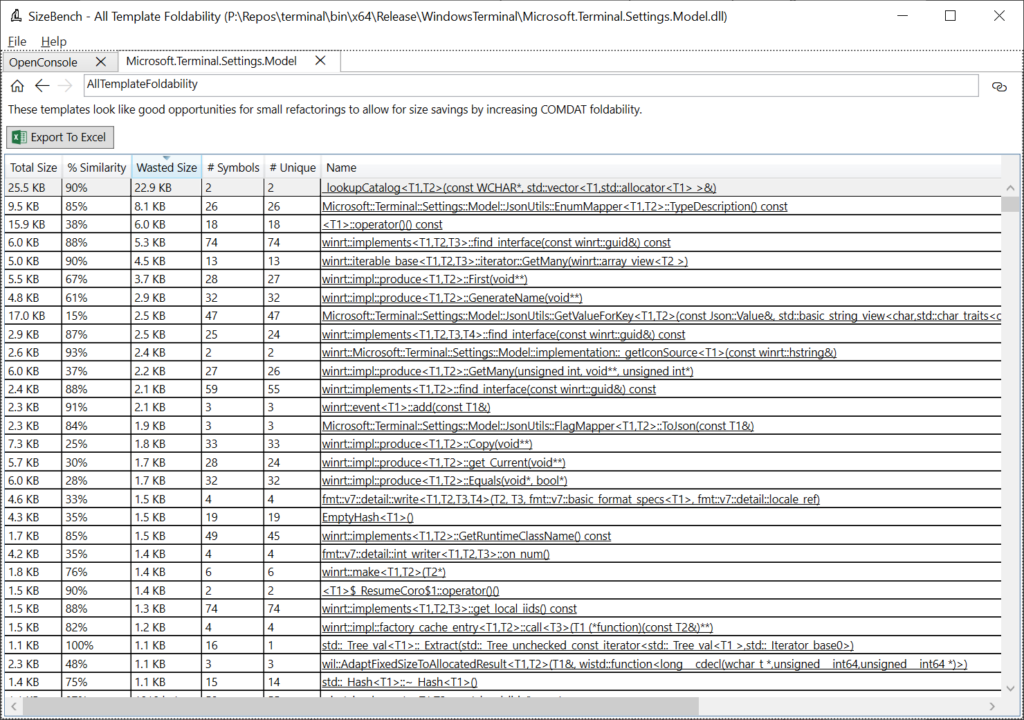
Let’s look at the first row as a good example. This says there are 2 symbols that match this pattern:
_lookupCatalog<T1, T2>(const WCHAR*, std::vector<T1, std::allocator<T1>>&)
Of those two symbols, the “# Unique” column tells us that both remained at unique addresses in the binary after linker dead code detection, COMDAT folding (/OPT:ICF), etc. Together these two copies take up 25.5 KB, and they are 90% similar to each other, so 22.9 KB of that is wasted (duplicated) between the two.
Clicking on that row, we can drill in to see more detail:
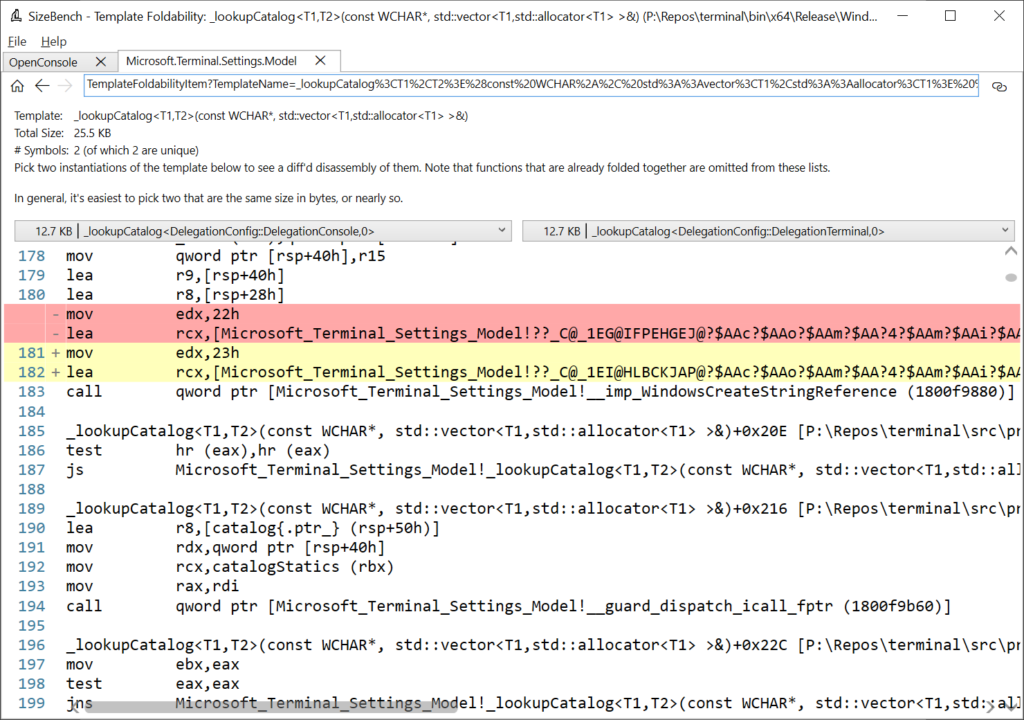
SizeBench uses the disassembly engine powering WinDbg Preview to get the full disassembly listing of two copies of this template to show where they differ which is preventing folding, and renders the results like you would see in a code review with highlighting of the differences between the two. In this case, each copy of this function is 12.7 KB in size yet scrolling through the disassembly shows almost identical assembly instructions everywhere. The two lines above that are highlighted in red/yellow are all that’s preventing these two copies from being identical, so SizeBench underestimated the similarity – it’s even higher than 90%.
Scrolling to the right even shows exactly what line of source code relates to this assembly code:
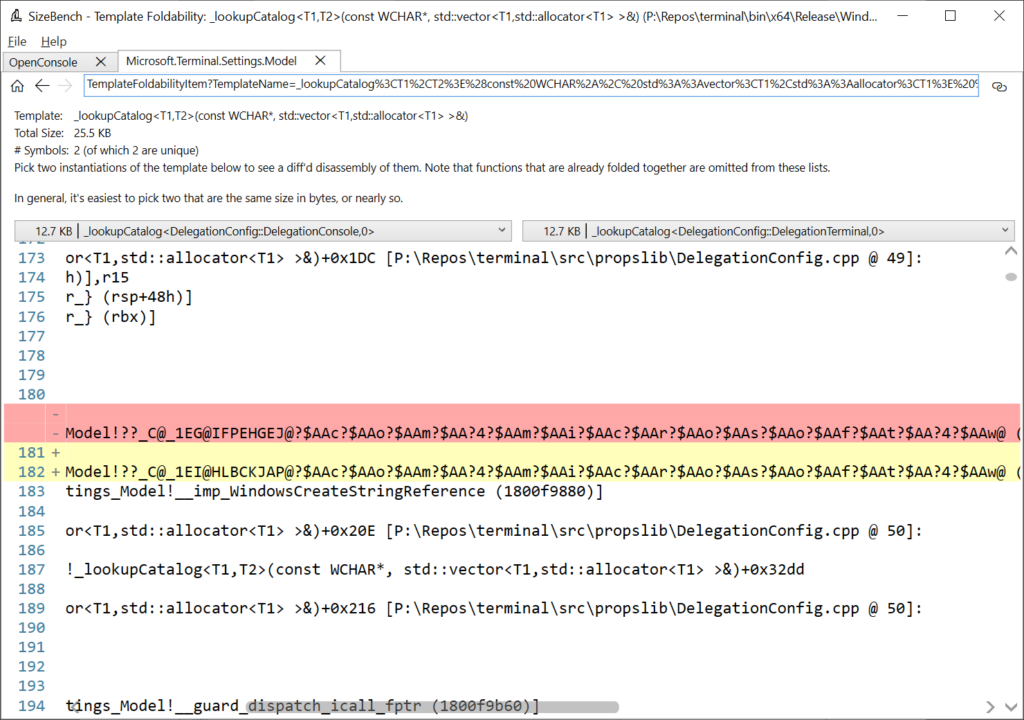
So now we could go look at DelegationConfig.cpp line 49 to see if we can figure out why these didn’t quite fold, and perhaps fix it. The help documentation in SizeBench talks more about patterns you can apply to try to improve foldability.
The Edge team applied this analysis to the Chromium codebase and identified a good commonly-used template in the mojo library and fixed it in this Pull Request, if you’d like to see a real world example of changing just a few lines of code and saving almost 50 KB.
But Wait, There’s More!
SizeBench can also help visualize the layout of types in memory and show annotations present in the PDB that some tracing systems use, but this post is already long enough so I’ll stop the demos and screenshots here.
Notable Limitations
SizeBench has a couple of important limitations to be aware of.
- It can only analyze native binaries – it has been designed to analyze C and C++ code though some folks have had modest success using it for Rust code. Currently SizeBench can’t understand managed code like C#, VB.NET or F#. It is also not aware of languages like Java, JavaScript, Python, Lua, and so on.
- It requires that you link with Microsoft’s linker (link.exe). The PDB files produced by other linkers like Clang’s lld-link currently do not contain enough information for SizeBench’s static analysis. You can still compile with Clang to produce OBJ files, then link those OBJ files with Microsoft’s linker, if you want to use Clang as a complier but use SizeBench to analyze the results – they won’t match exactly with lld-link’s output, but it’s usually close enough for SizeBench’s analyses and recommendations to apply.
- If your binary violates the C++ One Definition Rule (ODR) then parts of SizeBench may be inaccurate as the tool relies on understanding type information and ODR violations break this assumption. It’s a good idea not to violate ODR anyways for correctness concerns.
Some Fun History, and How We’ve Used This at Microsoft
Now that you’ve seen what SizeBench is about, it might be fun to talk a little about the history of the tool and a bit about how we’ve used it internally.
I started developing SizeBench during the Windows Phone days mostly out of curiosity – my team had a bunch of code, and a bunch of bytes ended up on disk, but I couldn’t figure out the relationship between the two. I asked around for tools to help with that but sadly found none, so I figured I could try to build one. Little did I know that this curiosity would turn into 8+ years of spelunking around and building a tool in my spare time 😊
As the tool has gained functionality, it has ended up spreading around the company with people using it for Windows, Office, Dynamics, Edge, several of our Game Studios, and more. We now run SizeBench analyses on every binary in Windows, in every development branch, every day. The Office team is experimenting with using the diffing functionality each time a new feature comes in through their engineering system. The Edge team has been able to contribute several fixes back to Chromium with this.
My two favorite examples of using SizeBench internally have been:
- We were able to shrink the code of a game on Xbox One by 45% which allowed for more memory for game assets.
- We did a deep-dive into the cost of C++ exceptions across the whole Windows codebase and with the help of @ryanshepherd the MSVC team was able to develop a new set of exception handling data structures, which now ships as __CxxFrameHandler4. When we brought that change back to all of Windows, it saved over 100 MB of disk footprint from the OS, without changing a single line of code!
The list of folks and products that have been using SizeBench over the past several years is long, and it’s been really gratifying to see lots of people finding lots of neat things. I’ve been so excited as I prepared to release this tool to everyone so all our developers building 3rd party apps can get access to this – and I’m looking forward to adding ever more features too!
Many folks have asked me at one point or another where the name came from. It’s two things – one is that it feels like benchmarking conceptually to look at code and get numbers out, and two is that I think of the tool a bit like a workbench. You set your binary down on the workbench, get out your tools and take it apart piece by piece to see what makes it tick. The name is about size, obviously, but also about benchmarking and about workbenches, and I wish I had a cooler story than that.
Feedback
If you have any feedback about SizeBench, please reach out to SizeBenchTeam@microsoft.com – we’ll hopefully have a GitHub repo to file issues on soon.
0 comments