Azure Fluid Relay (AFR) service helps developers build real-time collaborative experiences with seamless coauthoring and data synchronization. The AFR service uses Nodejs for building its microservices and hosts them on Azure Kubernetes Service. For Kubernetes metrics collection, monitoring, and observability AFR uses Azure Monitor Managed Service for Prometheus. For Kubernetes metrics collection, monitoring and observability AFR uses Azure Monitor Managed Service for Prometheus.
Prometheus is an open-source monitoring system with a dimensional data model, flexible query language, efficient time series database and modern alerting approach. This article demonstrates how AFR leverages Prometheus metrics in determining cluster load and based on that information can restrict the cluster from taking in additional traffic once it reaches certain thresholds.
Prometheus setup in AFR
Azure Monitor managed service for Prometheus is a component of Azure Monitor Metrics, providing more flexibility in the types of metric data that you can collect and analyze with Azure Monitor.
Azure Monitor managed service for Prometheus allows you to collect and analyze metrics at scale using a Prometheus-compatible monitoring solution, based on the Prometheus (Prom). This fully managed service allows you to use the Prometheus query language (PromQL) to analyze and alert on the performance of monitored infrastructure and workloads without having to operate the underlying infrastructure.

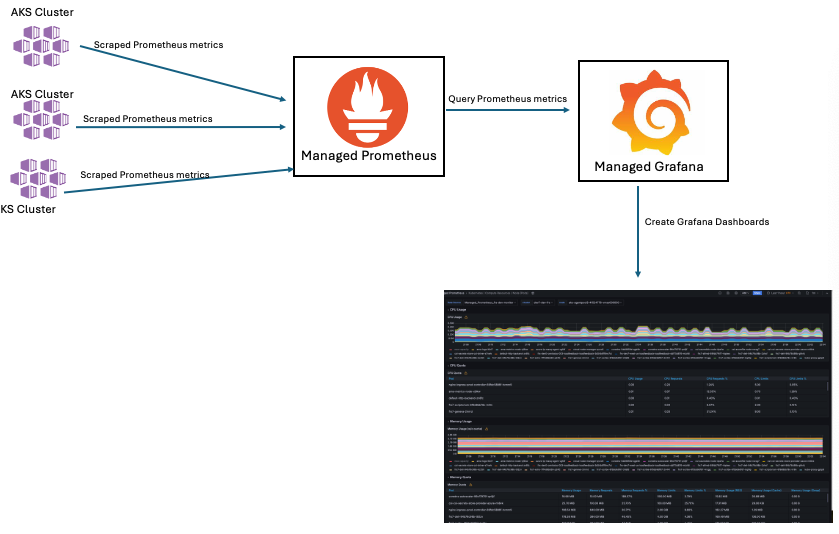
Once monitoring is activated on the AKS cluster, Prometheus Agents begin operating within the cluster and transmit Prometheus metrics to the Azure Monitoring Workspace. The data can then be imported into Azure Managed Grafana for visualization. AFR utilizes a predefined list of metrics to gather information from the AKS cluster and services like Istio and Nginx, which also support Prometheus metrics. This enables us to monitor all critical components of the system. In the future, we intend to add custom metrics in Prometheus, such as session-related errors and component failures.

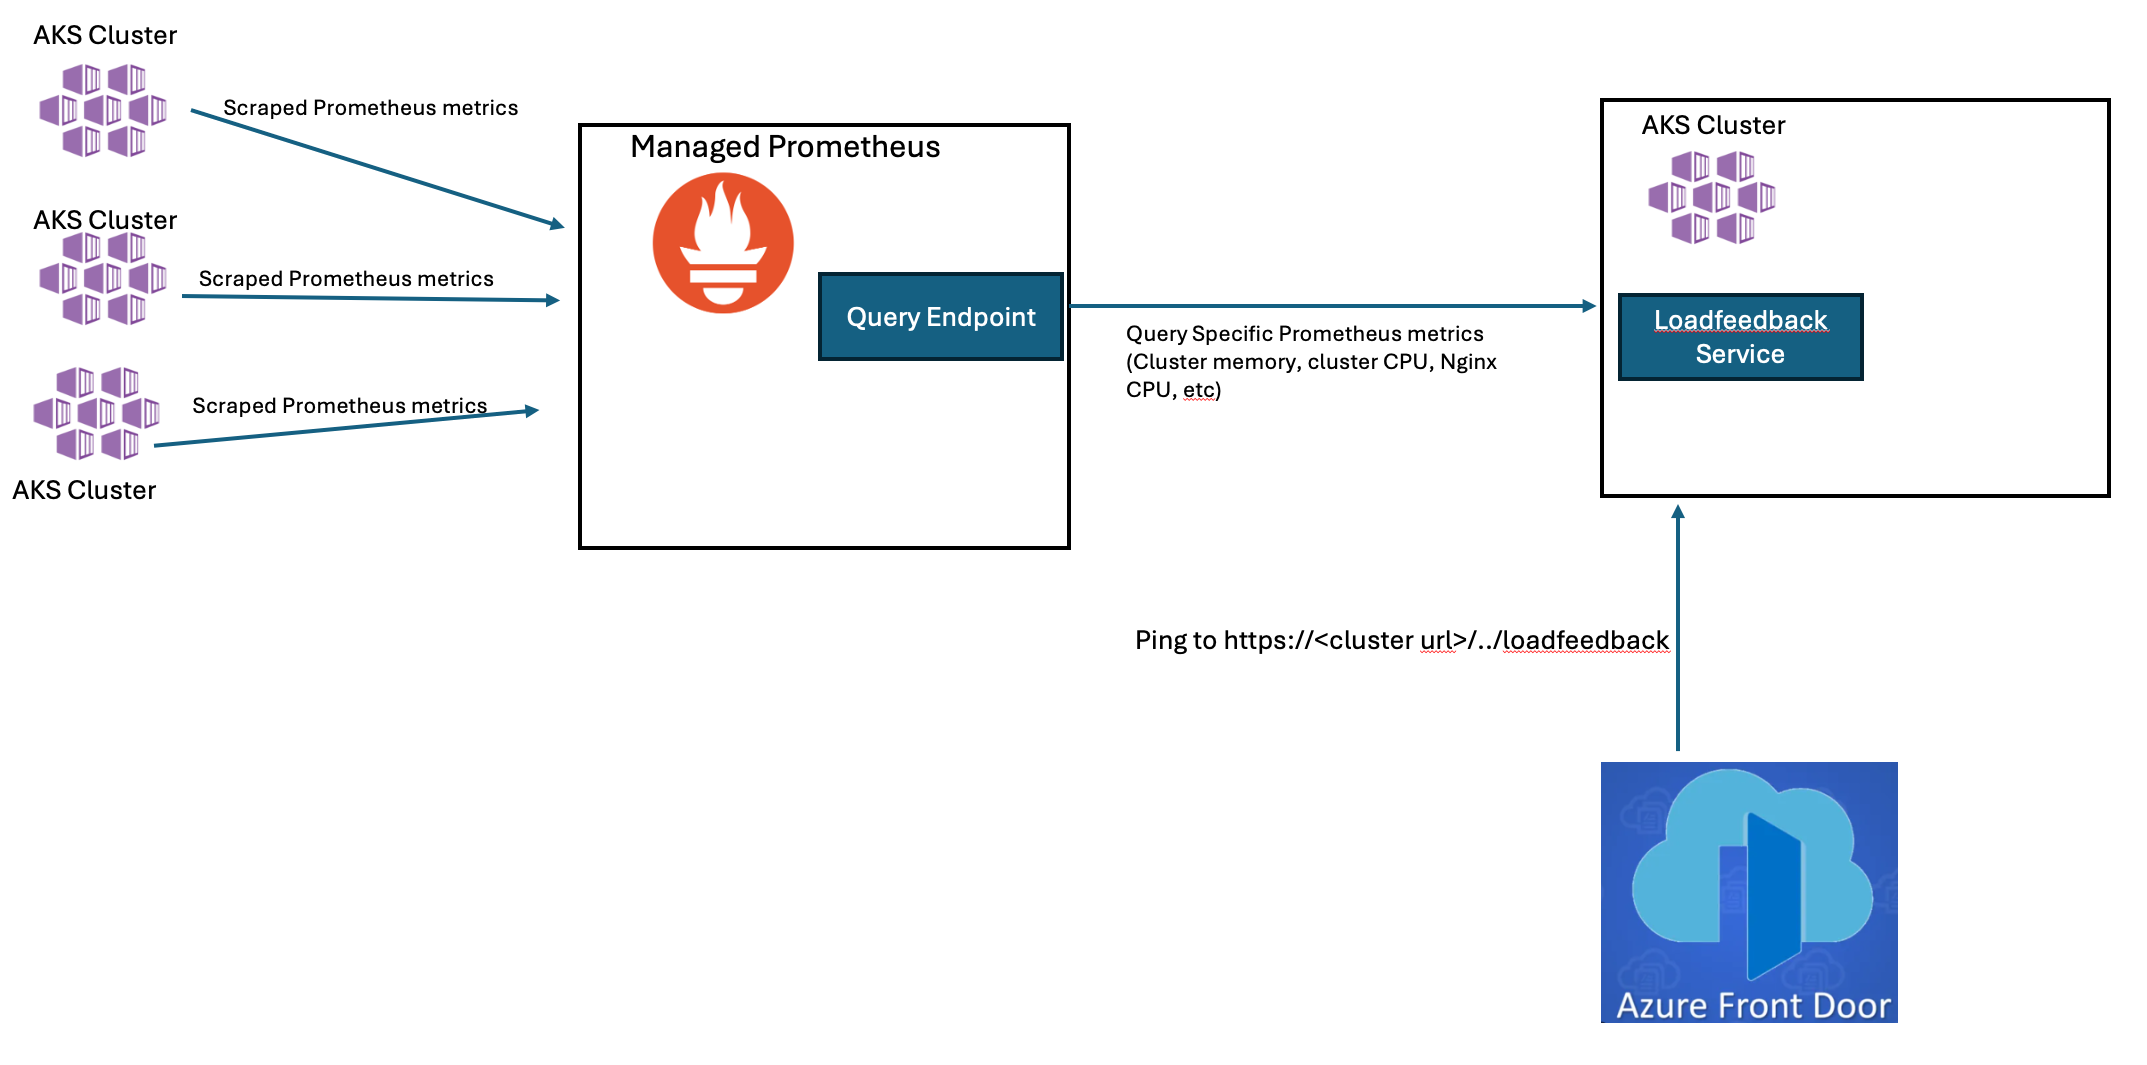
In addition to observability, Managed Prometheus also exposes a data collection endpoint that can be queried for specific metrics and perform further analysis. AFR leverages this feature for determining cluster health and making itself unavailable to Azure Front Door when it is determined that the cluster is full. when it is determined that the cluster is full.
The Loadfeedback service
AFR is deployed across multiple AKS clusters located in various Azure regions, and each AFR cluster operates several microservices. One of these services is called Loadfeedback. The Loadfeedback service queries the Prometheus endpoint to retrieve summarized metrics for each cluster. It then filters the relevant metrics that indicate cluster load, such as Cluster and Node CPU usage, Cluster memory usage, and Nginx CPU utilization, based on predefined thresholds. AFR continuously experiments to establish optimal thresholds for these metrics, which are then saved as cluster settings and utilized by the Loadfeedback service to assess cluster load. This enables Loadfeedback to determine when a cluster has reached its capacity and should stop accepting additional traffic for new sessions.

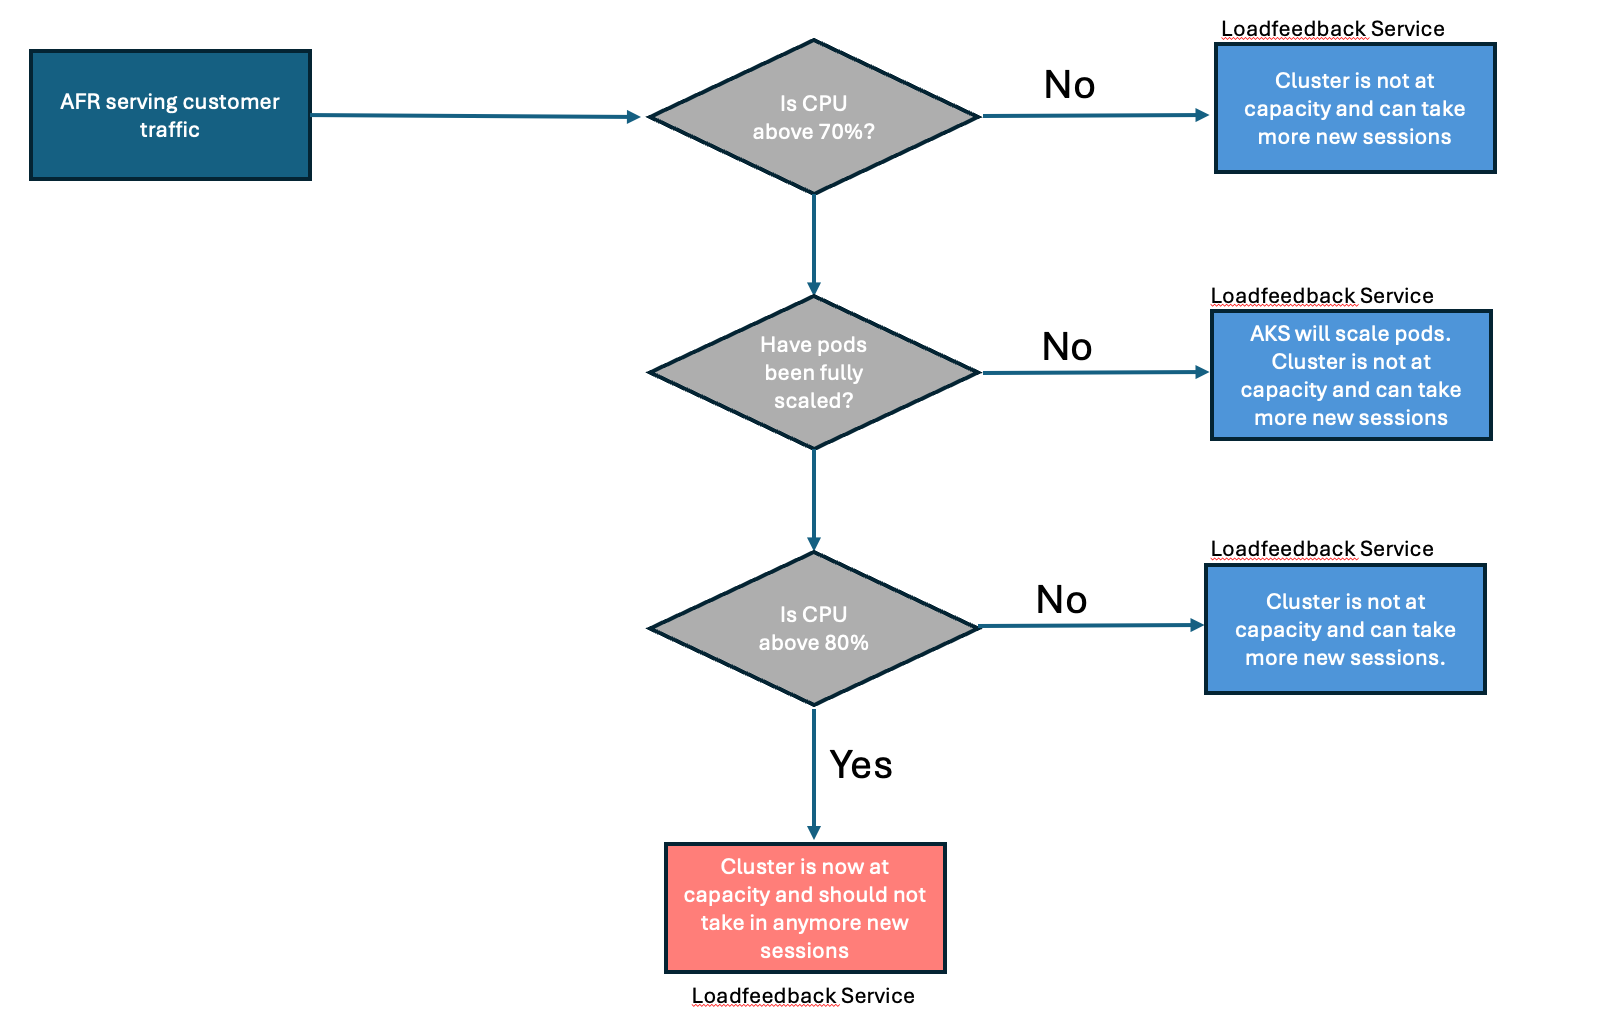
AFR also takes advantage of Horizontal Pod Scaling (HPA) as a way to automatically scale clusters based on traffic load. The predetermined limits that Loadfeedback sets are a little bit higher than the limits HPA sets so that the Loadfeedback determines a cluster to be full only after it has fully autoscaled. Here is an example: by conducting experiments, we discovered that AFR operates optimally until the cluster reaches 80% CPU usage. Beyond this point, latency increases, so we aim to avoid running the service above 80% CPU usage. At the same time, we want to maximize the compute capacity of our clusters and optimize our COGs. To balance these objectives, we can set the HPA autoscaling CPU threshold to 70% and the Loadfeedback threshold to 80%. Before peak traffic impacts a cluster (typically around 9am on weekdays in any specific Azure Region), the pods are at their minimum count. As traffic begins to increase and Kubernetes detects that the CPU usage has exceeded 70%, it triggers the HPA. This process continues until Kubernetes scales up to its maximum pod limit. After reaching this limit, if additional traffic arrives, the average CPU usage across all pods in the cluster exceeds 70%. Once it hits 80%, Loadfeedback identifies the cluster as full and prevents it from handling more traffic. Besides CPU, Loadfeedback considers other metrics before determining that a cluster is full.

Use of Loadfeedback in AFD
AFR utilizes Azure Front Door (AFD) for both traffic routing and load balancing. To assess whether traffic can be directed to a specific cluster, it pings an endpoint for each cluster and measures the roundtrip latency (read more about this). The endpoint provided to AFD is maintained by the load feedback service. When the load feedback service identifies that a cluster is at capacity, it makes the endpoint unavailable by returning a 500 (Internal Server Error) HTTP status code. Upon receiving a 500 status code in response to its ping, AFD seeks the next available cluster that returns a 200 (OK) HTTP status code. Once the load feedback service checks the Prometheus service endpoint and finds that metrics have dropped below the thresholds, signifying the cluster is ready to handle additional sessions, it reinstates the endpoint by returning a 200 status code to AFD pings. This allows AFD to route new client requests to that cluster.

Fluid Framework 2 is production-ready now! We are excited to see all the collaborative experiences that you will build with it.
Visit the following resources to learn more:
- Get Started with Fluid Framework 2
- Sample app code using SharedTree DDS and SharePoint Embedded
- For questions or feedback, reach out via GitHub
- Connect directly with the Fluid team, we would love to hear what you are building!
- Follow @FluidFramework on X (Twitter) to stay updated


0 comments