We are excited to announce that Application Performance Monitoring (APM) is now fully integrated into Azure Spring Cloud, powered by Application Insights.
Azure Spring Cloud is jointly built, operated, and supported by Microsoft and VMware. It is a fully managed service for Spring Boot applications that lets you focus on building the applications that run your business without the hassle of managing infrastructure.
APM in Azure Spring Cloud offers in-depth performance monitoring for your Spring applications without requiring ANY code changes, recompiling, retesting, or redeployment. APM on Azure Spring Cloud is so seamless that you get the insights on your applications just out of the box. You do not have to do ANYTHING – just deploy your applications and the monitoring data starts flowing. The benefits you get with application monitoring are:
- Visibility into all your applications with distributed tracing, including paths of operation requests from origins to destinations and insights into applications that are operating correctly and those with bottlenecks.
- Logs, exceptions, and metrics in the context of call paths offer meaningful insights and actionable information to speed root cause analysis.
- Insights into application dependencies – SQL Database, MySQL, PostgreSQL, MariaDB, JDBC, MongoDB, Cassandra, Redis, JMS, Kafka, Netty / WebFlux, etc.
- Performance data for every call into operations exposed by applications, including data-like request counts, response times, CPU usage, and memory.
- Custom metrics conveniently auto-collected through Micrometer, allowing you to publish custom performance indicators or business-specific metrics and visualize deeper application and business insights.
- Ability to browse, query, and alert on application metrics and logs.
While both Azure Spring Cloud and Application Insights Java agent are generally available, their integration for out of the box monitoring is in preview.
“Improvements in Azure Spring Cloud are always welcome, especially when they seamlessly integrate products from across the Azure ecosystem. A great example is the introduction of the 3.0 version of the Application Insights Java agent – now we can make better horizontal autoscaling decisions by capturing requests sent to our Netty powered Spring Cloud Gateway and SQL statements issued by our applications are captured and show very nicely in the application map”. –Jonathan Jones, Lead Solutions Architect, Swiss Re Management Ltd. (Switzerland)
“Raley’s is very excited by the continued enhancements to Azure Spring Cloud. With the addition of a Java in-process agent for Application Insights, our developers have fewer integration points to worry about! This enhancement promises to increase our productivity by reducing the development effort and decreasing the effort required to support and troubleshoot issues!” – Armando Guzman, Principal Software Engineer, Unified Commerce, Raley’s (United States)
You can enable the Java in-process monitoring agent when you create or update Azure Spring Cloud:
az spring-cloud create --name ${SPRING_CLOUD_SERVICE} \
--sku standard --enable-java-agent \
--resource-group ${RESOURCE_GROUP} \
--location ${REGION}
Then, you can open Application Insights created by Azure Spring Cloud and start monitoring applications and their dependencies – we will illustrate this using a distributed version of Spring Petclinic. Navigate to the Application Map blade where you can see an incredible, holistic view of microservices that shows applications that are operating correctly (green) and those with bottlenecks (red) [Figure 1]. Developers can easily identify issues in their applications and quickly troubleshoot and fix them.
Figure 1 – Microservice transactions in Application Insights
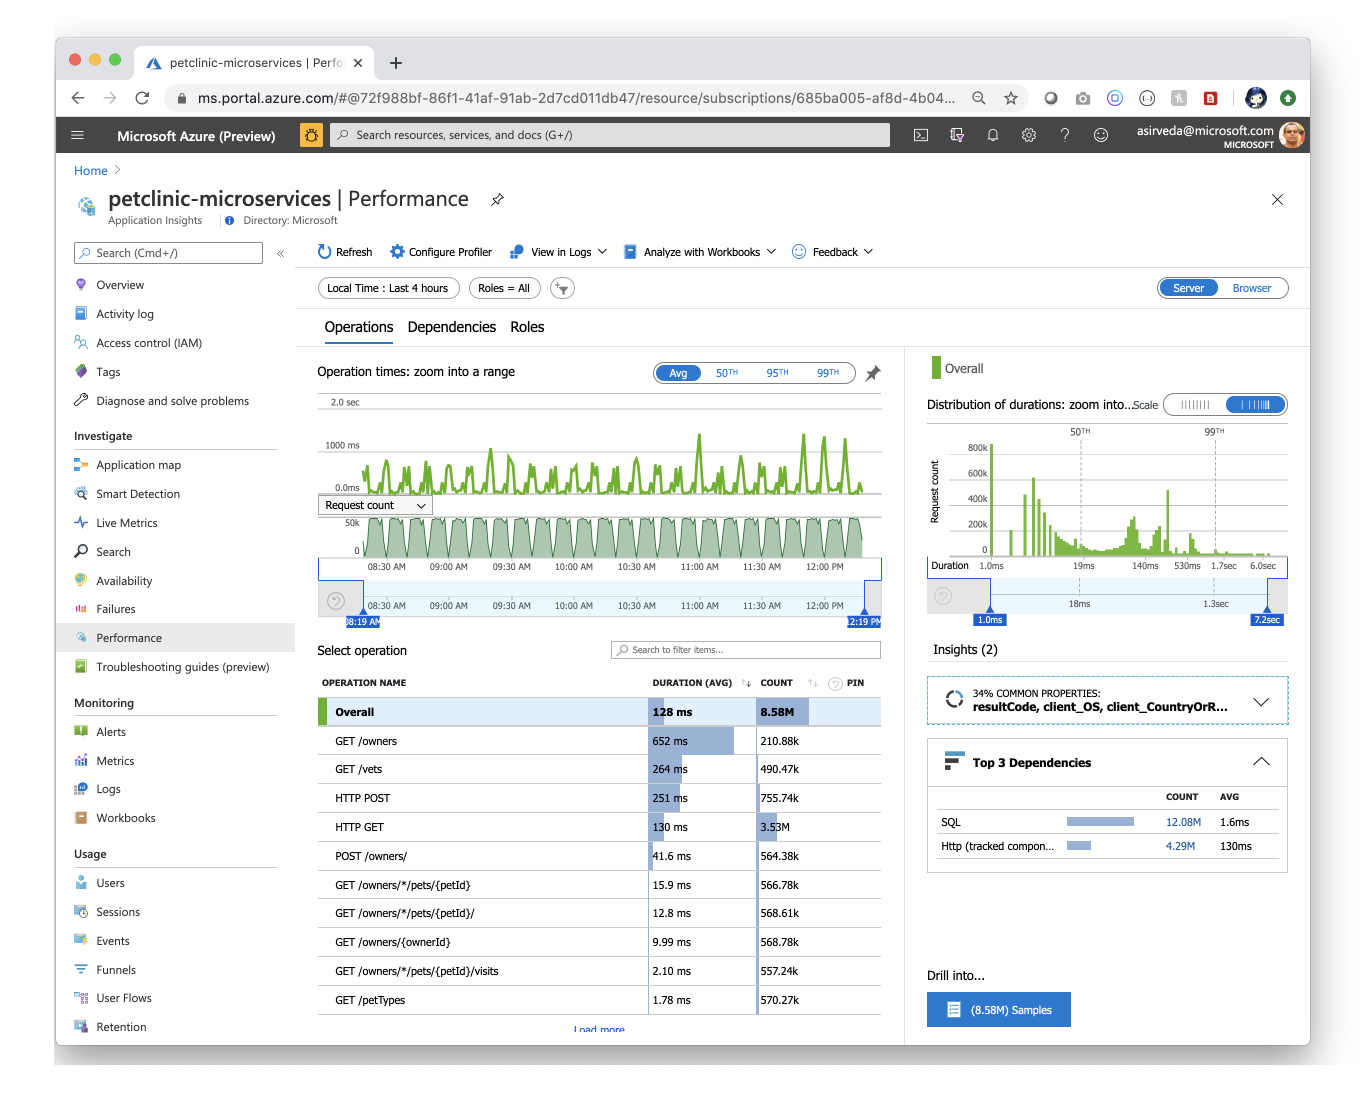
Navigate to the Performance blade where you can see response times and request counts for operations exposed by your applications [Figure 2].
Figure 2 – Performance of operations exposed by applications
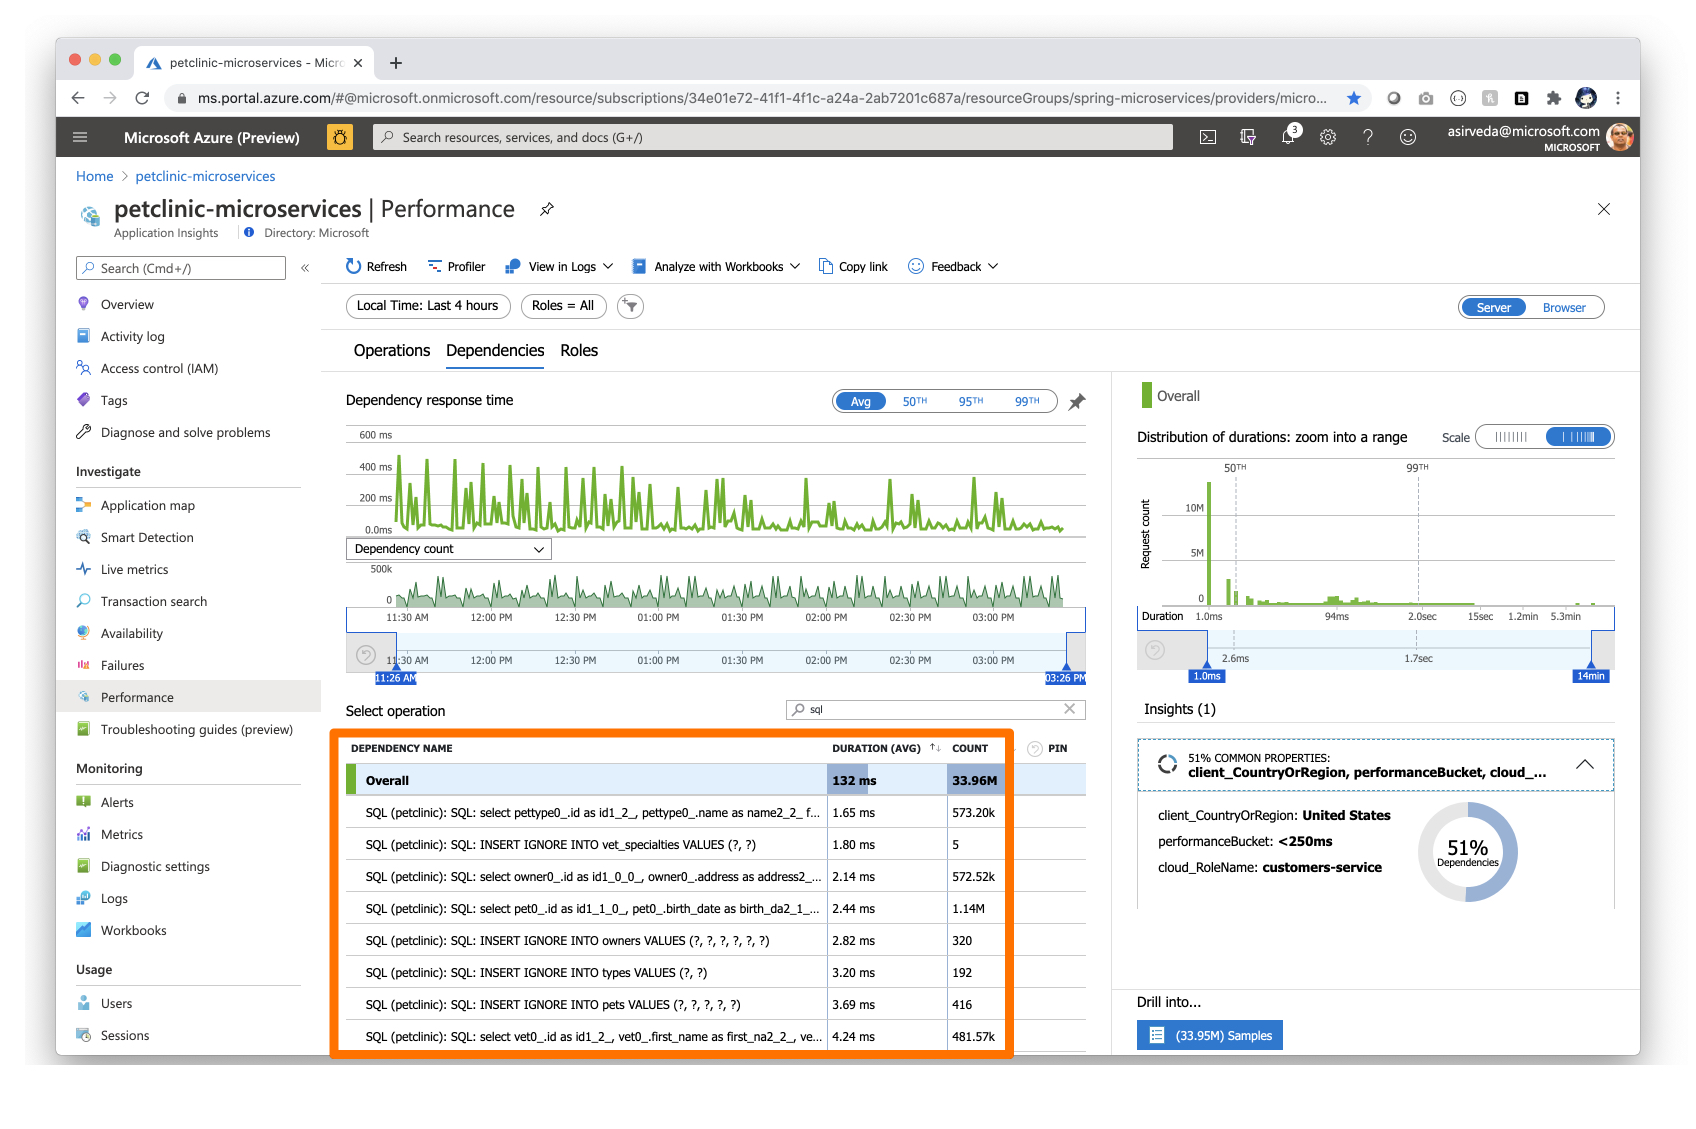
Navigate to the Dependencies tab in the Performance blade where you can see all your dependencies and their response times and request counts [Figure 3].
Figure 3 – Performance of application dependencies
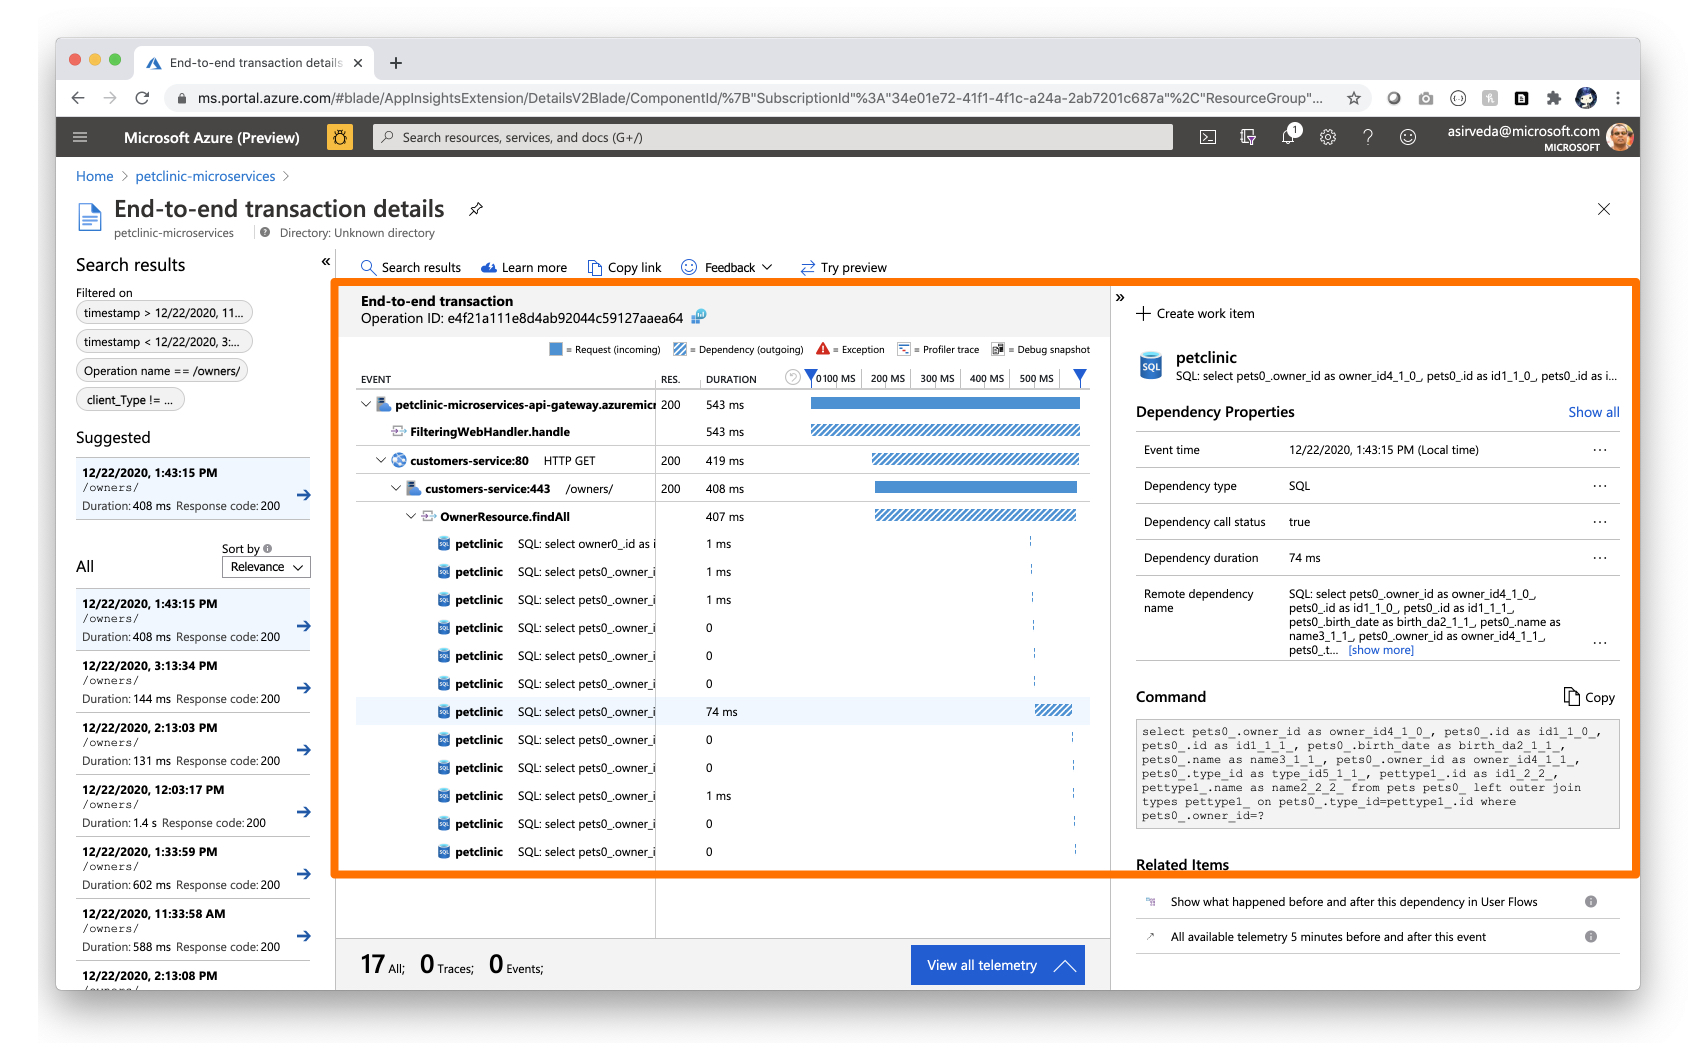
You can click a SQL call or a dependency to see the full end-to-end transaction in context [Figure 4].
Figure 4 – End-to-end application to SQL call transaction details
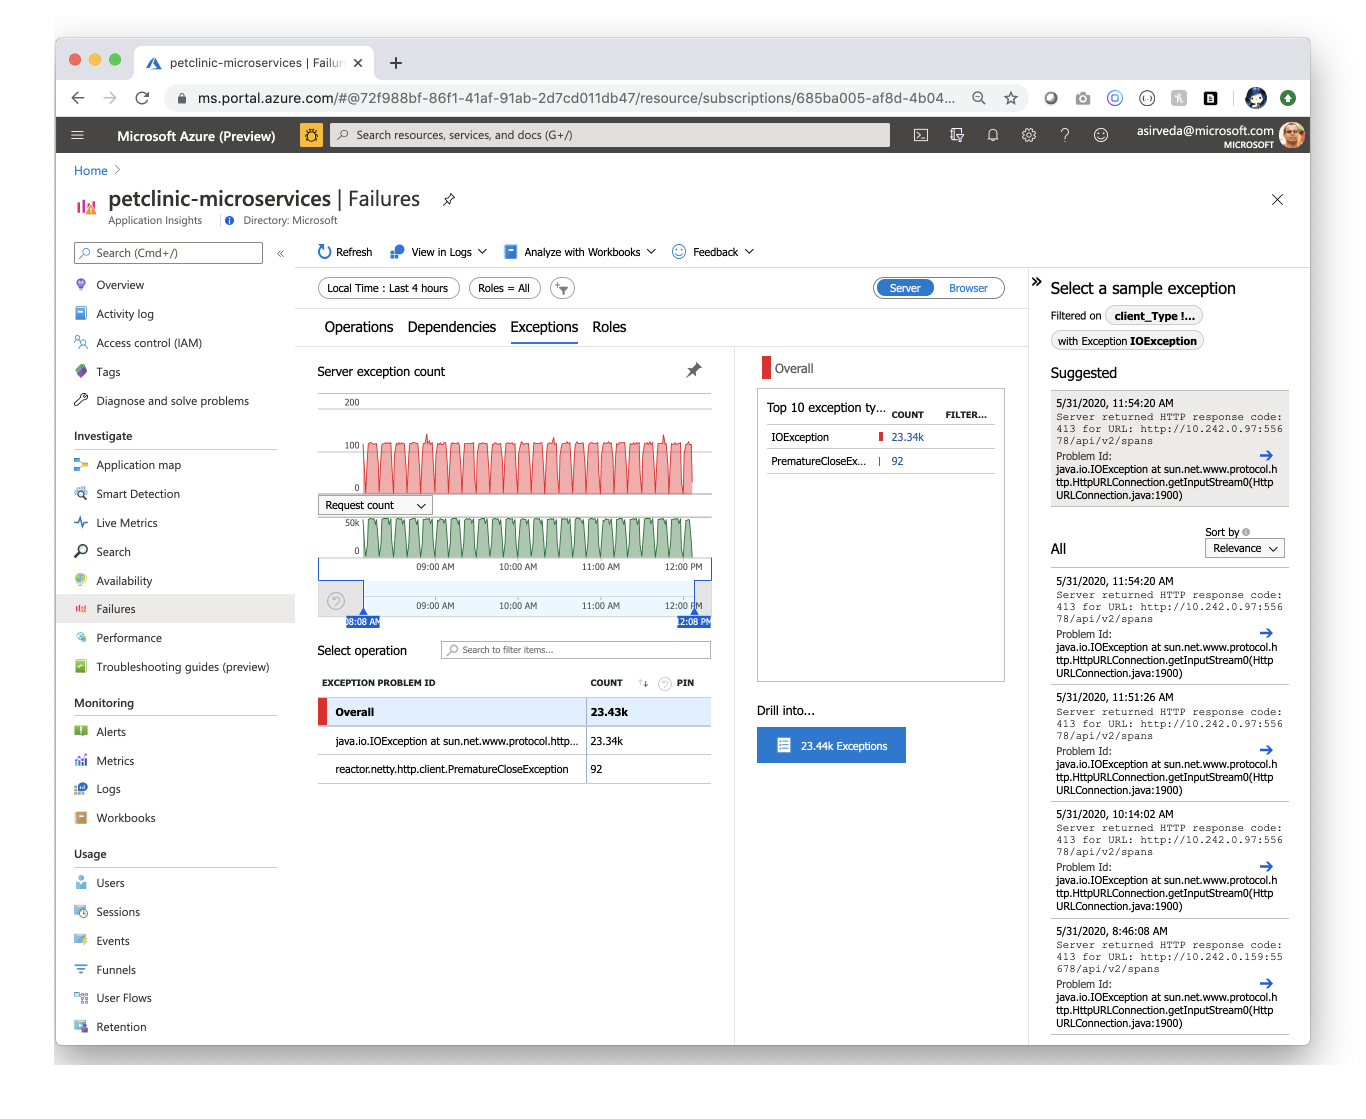
Navigate to the Exceptions tab in the Failures blade to see a collection of exceptions thrown by applications [Figure 5].
Figure 5 – Exceptions thrown by applications
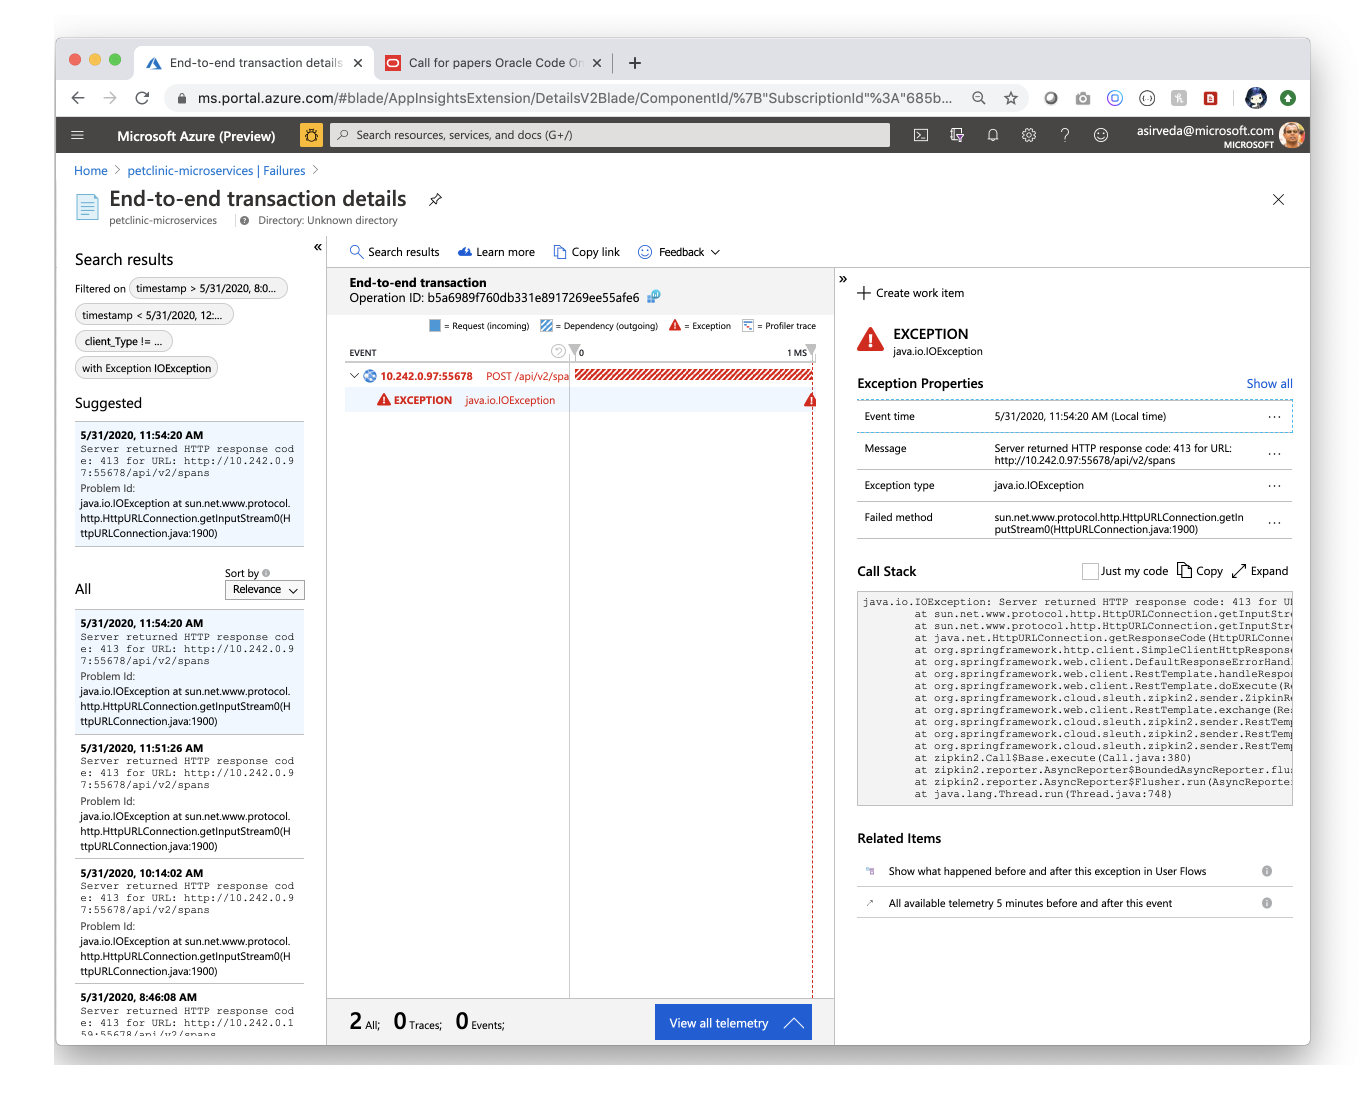
Simply select an exception and drill in for meaningful insights and actionable stack trace [Figure 6].
Figure 6 – End-to-end transaction details for an application exception
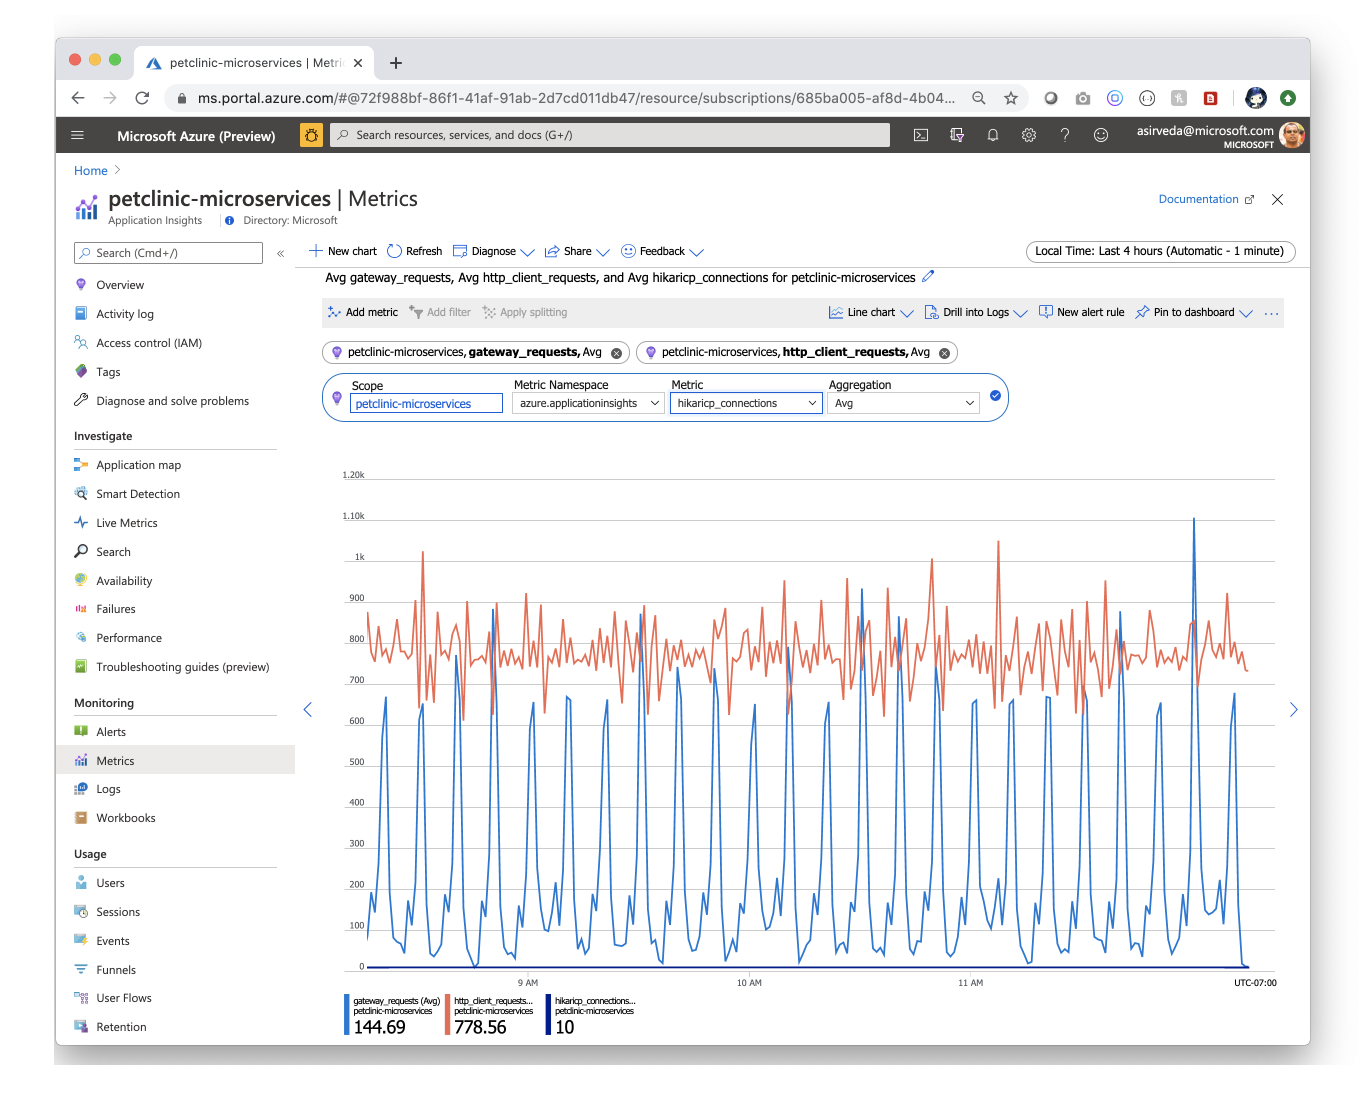
Navigate to the Metrics blade to see all the metrics contributed by Spring Boot applications, Spring Cloud modules, and their dependencies. The chart below showcases gateway-requests contributed by Spring Cloud Gateway and hikaricp_connections contributed by JDBC [Figure 7]. Similarly, you can aggregate Spring Cloud Resilience4J metrics and visualize them.
Figure 7 – Metrics contributed by Spring modules
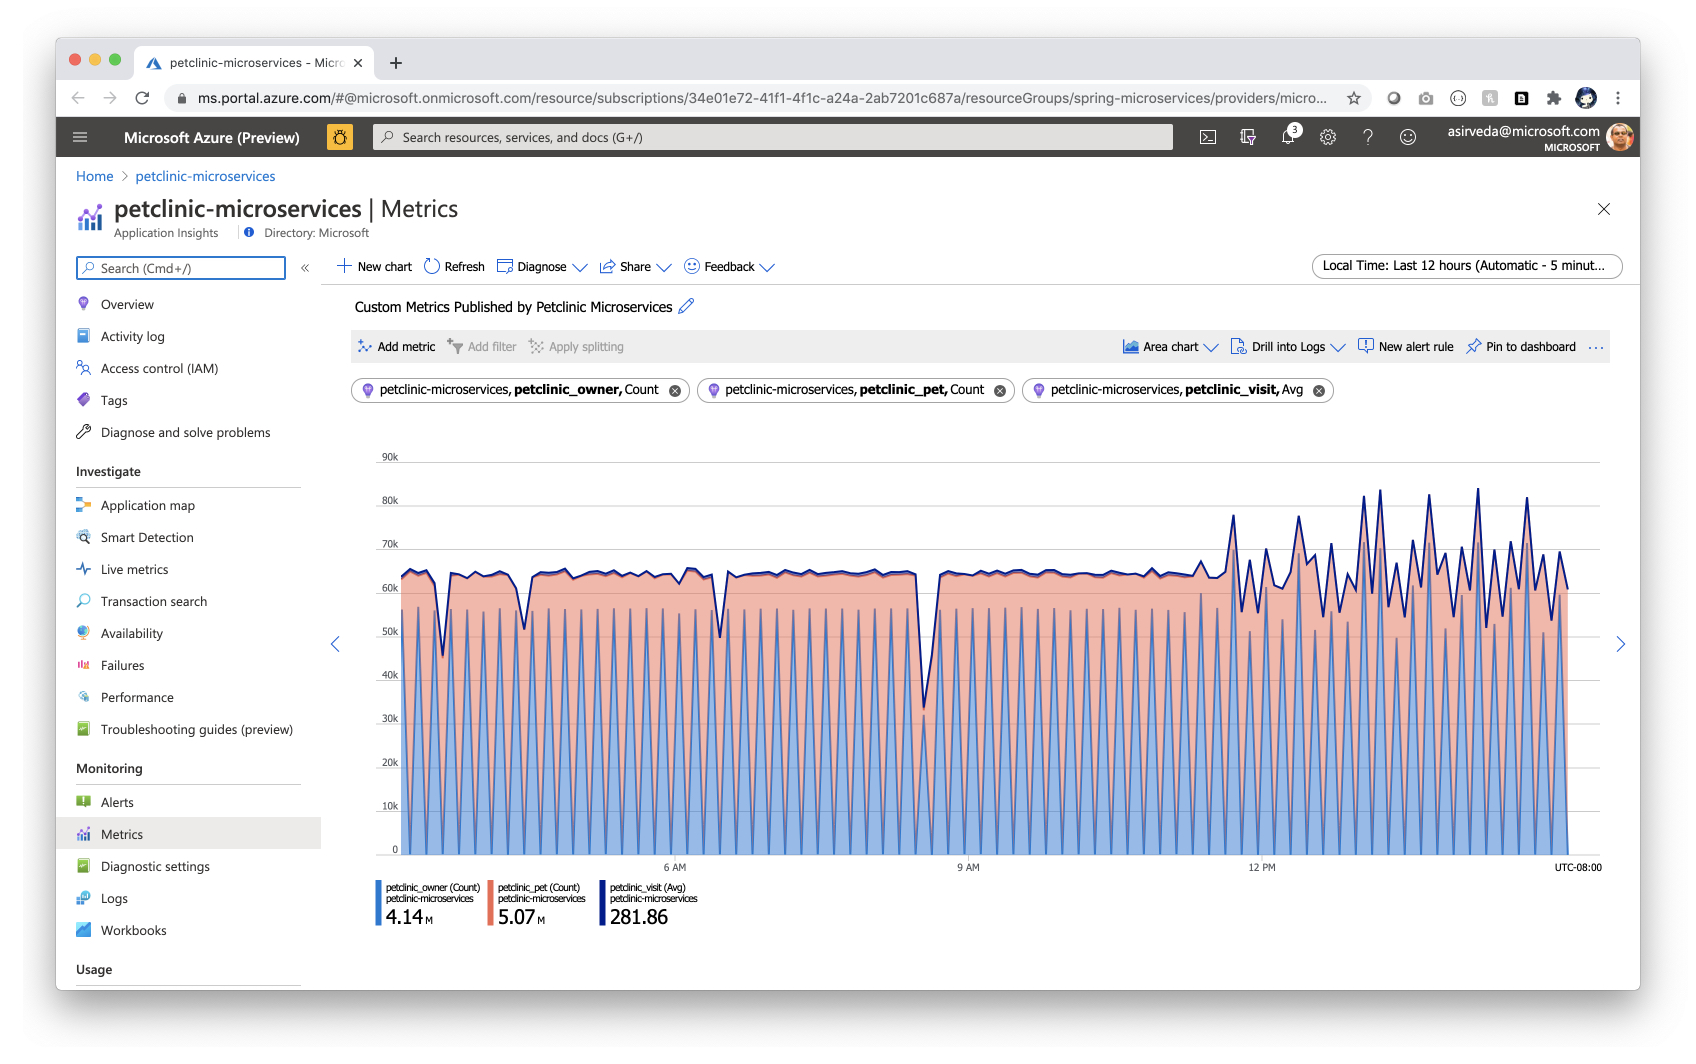
Spring Boot applications register a lot of core metrics – JVM, CPU, Tomcat, Logback, etc. You can use Micrometer to contribute your own custom metrics, say using the @Timed Micrometer annotation at a class level. You can then visualize those custom metrics in Application Insights. As an example, see how pet owners, pets, and their clinical visits are tracked by custom metrics below –you can also see how the pattern changes at 9 PM because applications are driving higher utilization when autoscaling kicked in [Figure 8].
Figure 8 – Custom metrics published by user applications
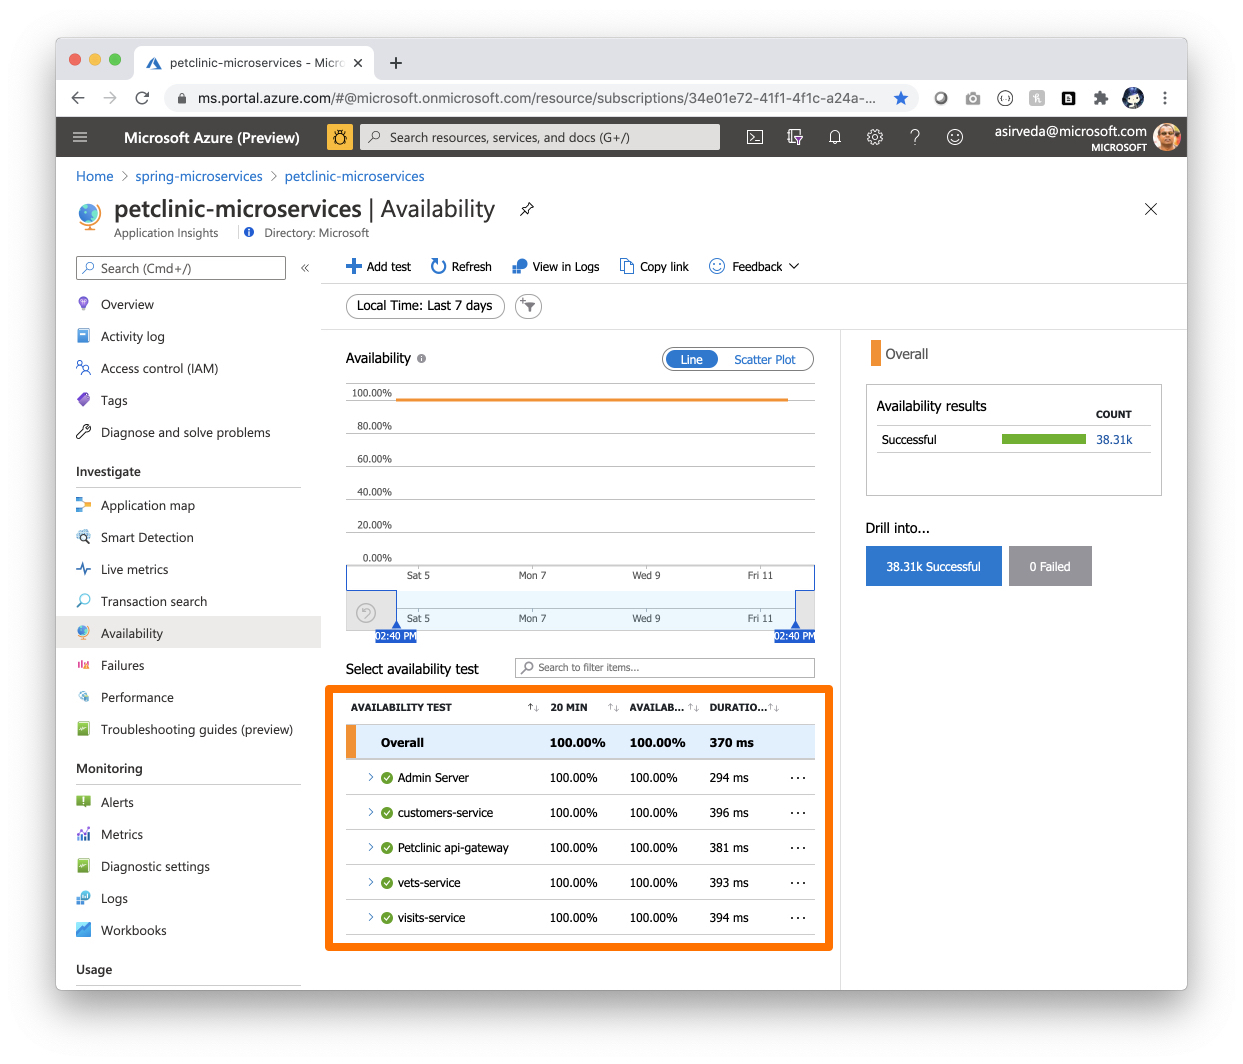
You can use the Availability Test feature in Application Insights to monitor the availability of applications in Azure Spring Cloud. This is a recurring test to monitor the availability and responsiveness of applications at regular intervals from anywhere across the globe. It can proactively alert you if your applications are not responding or if they respond too slowly. The chart below shows availability tests from across North America – West US, South Central, Central US, and East US [Figure 9].
Figure 9 – Availability of application endpoints across time
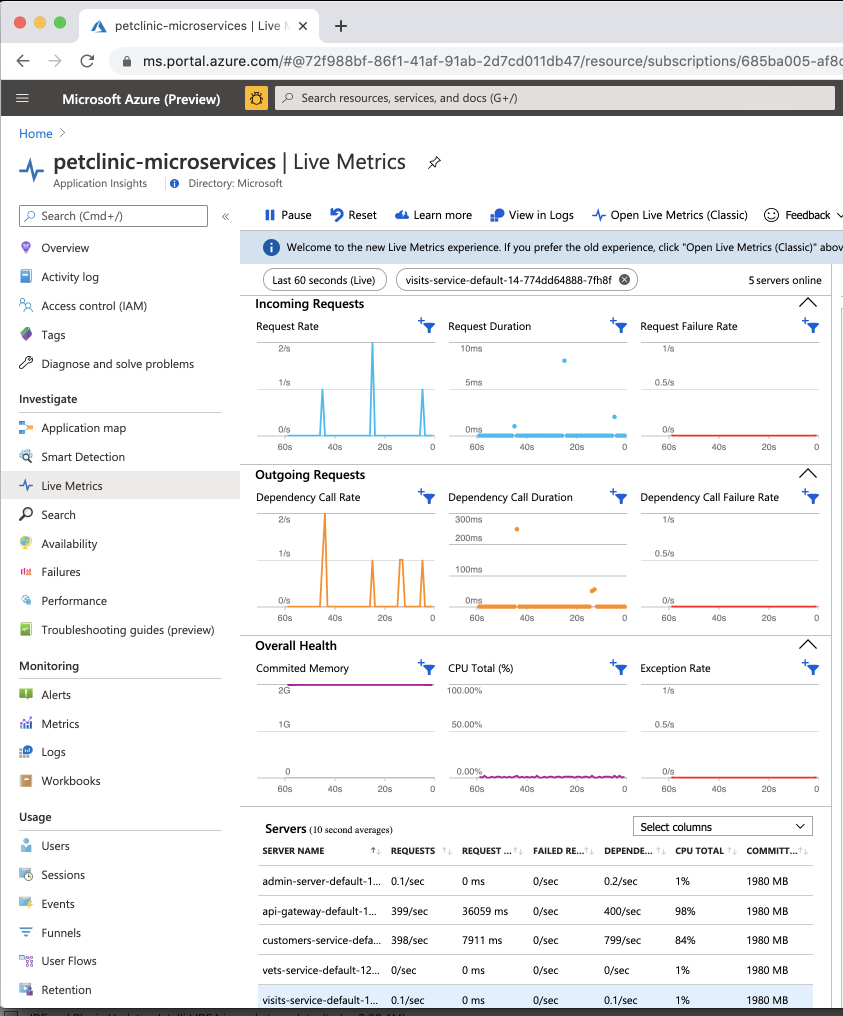
Navigate to the Live Metrics blade where you can see live metrics practically in real-time, within only one second [Figure 10].
Figure 10 – Real-time metrics
Application Insights Java agent is based on OpenTelemetry auto instrumentation effort, where Microsoft collaborates with other brightest minds of the APM space.
Build your solutions and monitor them today!
Azure Spring Cloud abstracts away the complexity of infrastructure management and Spring Cloud middleware management, so you can focus on building your business logic and let Azure take care of dynamic scaling, patches, security, compliance, and high availability. With a few steps, you can provision Azure Spring Cloud, create applications, deploy, and scale Spring Boot applications, and start monitoring in minutes. We will continue to bring more developer-friendly and enterprise-ready features to Azure Spring Cloud.
We would love to hear how you are building impactful solutions using Azure Spring Cloud. Get started today – deploy Spring applications to Azure Spring Cloud using quickstart!
Resources
- Learn using an MS Learn module or self-paced workshop on GitHub
- Learn more about implementing solutions on Azure Spring Cloud
- Learn more about Application Insights Java in-process agent in Azure Spring Cloud, including Spring Cloud Resilience4J Circuit Breaker metrics
- Deploy a distributed version of Spring Petclinic built with Spring Cloud
- Migrate your Spring Boot, Spring Cloud, and Tomcat applications to Azure Spring Cloud
- Wire Spring applications to interact with Azure services
- For feedback and questions, please e-mail.

0 comments