We’re excited to announce that the Azure Performance Diagnostics Tool for Java is now available for preview as part of the Azure SRE Agent platform, bringing intelligent, automated Java performance diagnoses. Currently supporting Java workloads deployed to Azure Kubernetes Service (AKS) clusters.
What is Azure Performance Diagnostics Tool for Java via Azure SRE Agent?
The Azure Performance Diagnostics Tool for Java is a powerful new capability within Azure SRE Agent, an AI-powered service that automatically responds to site reliability issues. This feature enables development and operations teams to monitor, analyze, and troubleshoot Java Virtual Machine (JVM) performance issues with unprecedented ease.
Azure Performance Diagnostics Tool for Java can identify and diagnose common JVM problems, including:
- Garbage collection inefficiencies and pauses
- CPU resource utilization issues (both under- and over-utilization)
- Excessive I/O operations impacting application performance
- Thread contention
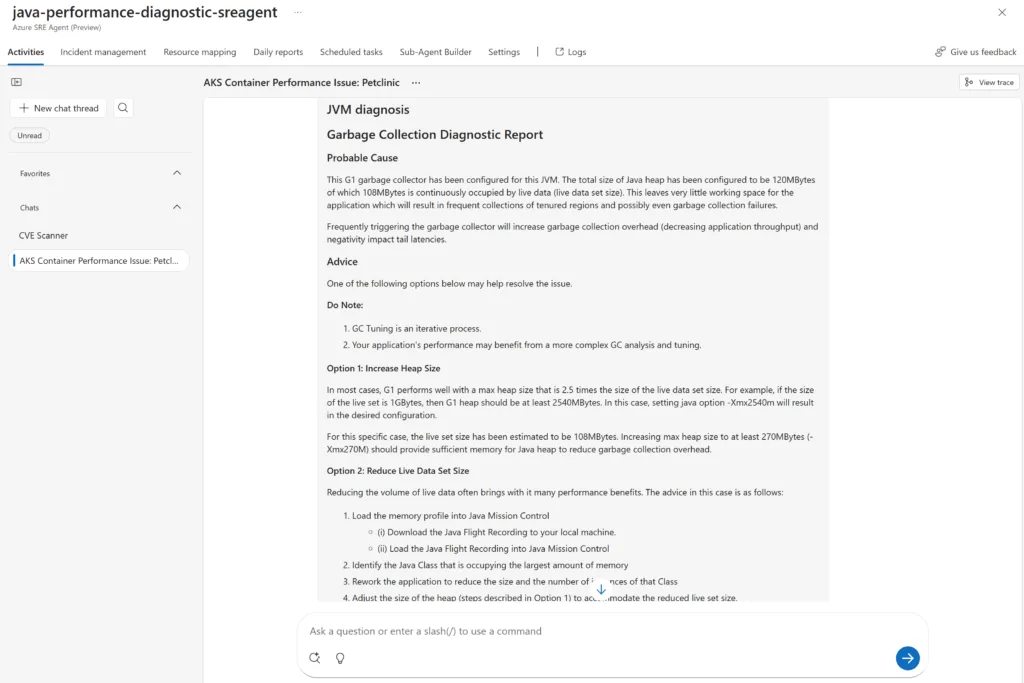
An example of a report highlighting a garbage collection issue would be as follows:

How Does It Work?
When Azure SRE Agent is tasked with solving a performance issue by the customer and it suspects that a JVM related issue is the cause, the agent immediately initiates a comprehensive diagnostic report. This allows your team to understand the root cause of this performance issue.
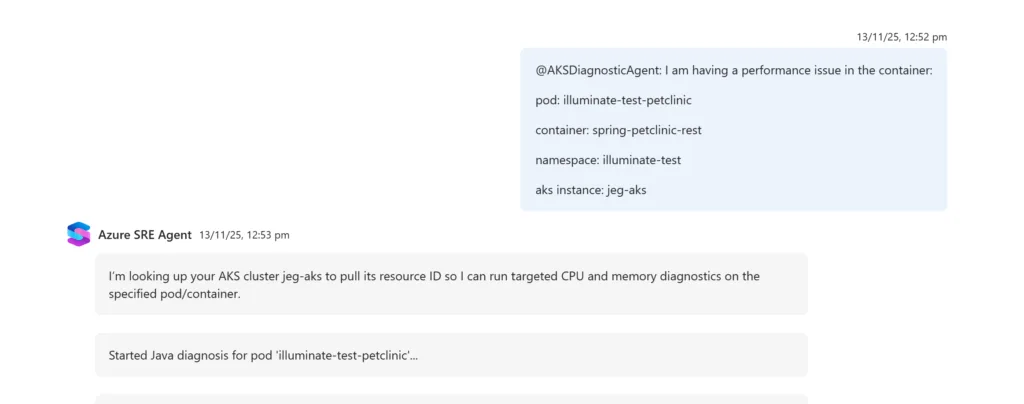
Teams can also manually request diagnostics through the Azure SRE Agent chat interface. Simply ask for a performance analysis of any Java service; you can even build your own Sub-Agent and integrate the AKS performance functions as part of that Sub-Agent. You can then directly ask your agent to perform Java diagnoses:
Take a look at it in action in the video below.
The Java Performance Diagnostic Process
When Azure SRE Agent suspects a performance issue (or is manually invoked to perform a Java performance investigation in your container), it:
- Spins up an ephemeral container within your pod
- Attaches to the target Java container without disrupting service
- Collects detailed performance telemetry using Java Flight Recorder (JFR)
- Analyzes the data and generates actionable insights
- Closes down the ephemeral container once the analysis is complete
This approach ensures zero downtime while providing deep visibility into JVM behaviour.
NOTE: For auditability reasons the Kubernetes API retains visibility of terminated ephemeral containers. As a result when looking at a pod for instance using kubectl describe pods the ephemeral containers will be visible, to prevent excessively generating noise within your environment, we have limited the pod to having run 5 diagnostic containers.
Getting Started
Setting up JVM Diagnostics is straightforward. Here are the requirements:
- Java applications deployed in AKS – Your Java services must be running within an Azure Kubernetes Service cluster
- Azure SRE Agent configuration – Ensure your Azure SRE Agent service is created and has appropriate access to your AKS cluster
- Pod annotation – Add the
languageStack=javaannotation to your pods to enable Azure Performance Diagnostics Tool for Java
Note: At time of writing the Java profiling feature is in the Early access features, to enable early access, within the SRE Agent UI, browse to Settings, Basics, and select Early access to features. The feature will progress to main line in the coming month.
Adding the required annotation is as simple as updating your pod specification:
apiVersion: v1
kind: Pod
metadata:
  name: your-java-app
  annotations:
    languageStack: java
spec:
  containers:
    - name: app
      image: your-java-app:latest
Alternatively, you can apply an annotation on the command line using kubectl:
kubectl annotate pod your-java-app languageStack=java
Annotating your pods indicates that they are running Java applications and that you consent to have them diagnosed using Azure Performance Diagnostics Tool for Java. As always with monitoring, although the diagnostic process is designed to be as non-intrusive as possible, there is a small amount of overhead involved when running the Java Flight Recorder profiler and the diagnostic container. It is recommended to first use this feature in non-production environments and ensure that the diagnostic process does not interfere with your application.
Build your own Sub-Agent
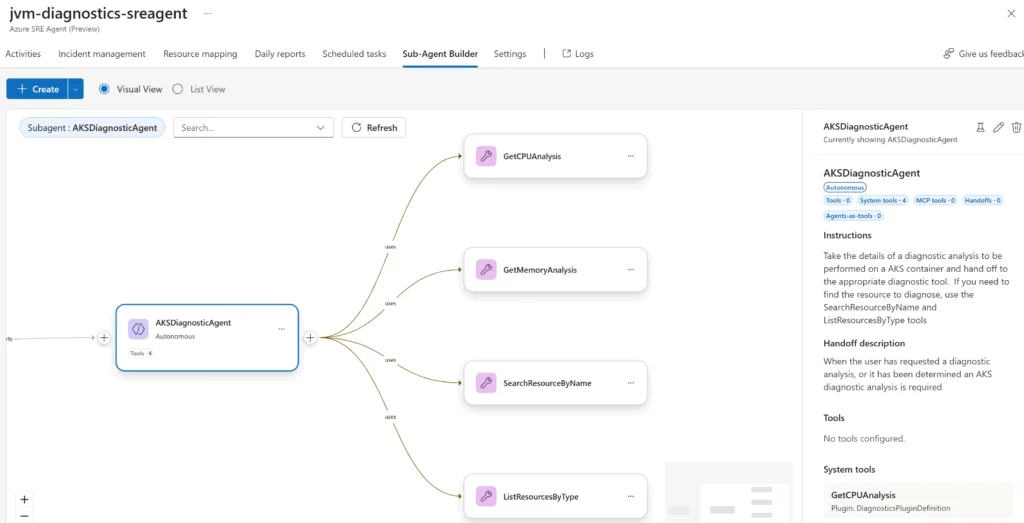
You can also create a custom Sub-Agent within Azure SRE Agent, and delegate to the AKS diagnostic analysis tools, in order to create an agent specifically for how you wish to respond to AKS diagnostic needs. You can also delegate to this agent when responding to an alert. The following is an example of how to configure a Sub-Agent which includes the Java Performance Diagnostic capability via the SRE Agent GUI:
Below is an example YAML configuration that can be pasted into the YAML input dialogue within the create a SRE Sub-Agent Builder UI:
api_version: azuresre.ai/v1
kind: AgentConfiguration
spec:
  name: AKSDiagnosticAgent
  system_prompt: >-
    Take the details of a diagnostic analysis to be performed on a AKS container and hand off to the
    appropriate diagnostic tool. If you need to find the resource to diagnose, use the
    SearchResourceByName and ListResourcesByType tools
  tools:
    - GetCPUAnalysis
    - GetMemoryAnalysis
    - SearchResourceByName
    - ListResourcesByType
    - AnalyzeJavaAppInAKSContainer
  handoff_description: >-
    When the user has requested a diagnostic analysis, or it has been determined an AKS diagnostic
    analysis is required
agent_type: Autonomous
You can then interact with this Sub-Agent via the Azure SRE Agent chat interface to request JVM performance analyses as needed, for instance:
/agent AKSDiagnosticAgent I am having a performance issue in:
pod: illuminate-test-petclinic
container: spring-petclinic-rest
namespace: illuminate-test
aks instance: jeg-aks
This will trigger the Azure Performance Diagnostics Tool for Java process and return a detailed report of findings and recommendations.


0 comments
Be the first to start the discussion.