
Introduction
Welcome to Part 2 of our investigation into a JVM crash for LinkedIn. This blog post continues the investigation we began in Debugging a JVM Crash for LinkedIn – Part 1. In Part 1, we analyzed the HotSpot error log file to identify the instruction where the JVM crashed.
As a reminder, this series is broken down as follows:
Analyzing the Core Dump
In addition to validating the disassembly we see with ODA, we can use the core dump to view the disassembly of an entire compiled method. The HotSpot error log file only provides an excerpt from the compiled function, but the core dump has access to all of it.
After obtaining the 15 GB core dump file from LinkedIn, we run Ubuntu on Windows Subsystem for Linux (WSL) (which allows one to run a Linux distribution on a Windows machine) and load the core dump using gdb:
gdb ./jdk-11.0.8+10/bin/java core.19538
We need to make sure that we are using the same Java executable that the Espresso-snapshots service is using, which in this case was version 11.0.8+10 of the Microsoft Build of OpenJDK.
Next, we want to look at the disassembled code where the crash occurred. The log file gives us this information about the compiled method:
J 52708 c2 sun.security.jgss.krb5.Krb5Context.initSecContext(Ljava/io/InputStream;I)[B java.security.jgss@11.0.8 (698 bytes) @ 0x00007ffb860d705f [0x00007ffb860d47c0+0x000000000000289f]
From this we can see that the compiled method starts at 0x00007ffb860d47c0, and the crash occurred at an offset of 0x000000000000289f from there, which results in an address of 0x00007ffb860d705f (0x00007ffb860d47c0 + 0x000000000000289f). This resulting address is also indicated here and elsewhere in the log file. Note that 0x000000000000289f in decimal is 10399.
In gdb, we can view the contents of the memory where the compiled method resides. We display 10500 bytes (‘b‘), starting at the beginning of the method, and show machine instructions (‘i‘), using the following command:
x/10500ib 0x00007ffb860d47c0
This gives us a paginated view of memory, starting from the very beginning of the compiled method. We can scroll through these pages by pressing <return> until we can see the instruction at 0x00007ffb860d705f:
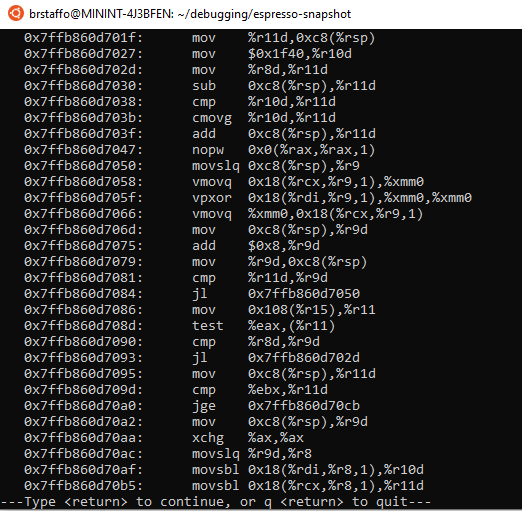
Here’s the instruction at the address in question:
0x7ffb860d705f: vpxor 0x18(%rdi,%r9,1),%xmm0,%xmm0
Note that gdb is displaying the disassembly here in AT&T syntax, not Intel syntax (see AT&T Syntax versus Intel Syntax for further details on the differences). However, it is the same instruction we saw when using ODA, so we take this as confirmation that this is the correct instruction we need to examine. So, let’s examine it!
Examining the Instruction
We note that vpxor is a vector instruction, so it looks like the code is doing some vector operations here. Let’s take a look at the Java code in question: Krb5Context.java. This code is security-related, and it’s not surprising that cryptographic algorithms require vector math. It’s also possible that the offending code is from a method inlined in initSecContext, for example something related to InitSecContextToken (see InitSecContextToken.java).
Let’s examine what this instruction is doing:
- It calculates an address based off of 0x18(%rdi, %r9,1). This addressing mode results in the following calculation: %rdi + %r9 * 1 + 0x18. In other words, it scales the contents of r9 by 1, adds it to the contents of rdi, and adds the constant 0x18.
- Loads a value from that address.
- Computes the xor of that value and the contents of the xmm0 register (a vector register).
- Stores it back into the xmm0 register.
Let’s see what this address calculation gives us. To do this, we look at the value of the registers at the time of the crash. You can find those values in the log:
Registers:

RAX=0x0000000000000007, RBX=0x0000000000000020, RCX=0x00007ffb75418ce0, RDX=0x000000000000001f
RSP=0x00007ff751956420, RBP=0x00007ffb75417b40, RSI=0x0000000000000019, RDI=0x00007ffb79ffffc8
R8 =0x0000000000000019, R9 =0x0000000000000018, R10=0x0000000000001f40, R11=0x0000000000000019
R12=0x00007ff751956900, R13=0x0000000000000001, R14=0x0000000000000000, R15=0x00007ff7fbaa0000
RIP=0x00007ffb860d705f, EFLAGS=0x0000000000010297, CSGSFS=0x0000000000000033, ERR=0x0000000000000004
TRAPNO=0x000000000000000e
Here are the values of the registers we’re interested in:
RDI: 0x00007ffb79ffffc8
R9: 0x0000000000000018
The base address that we’re accessing with this instruction is therefore:
Addr: 0x00007ffb79ffffc8 + 0x0000000000000018 * 1 + 0x18 = 0x7FFB79FFFFF8
Note that the address that is causing us trouble, 0x00007ffb7a000000, is only (0x00007ffb7a000000 – 0x7FFB79FFFFF8) = 8 bytes away from this calculated address.
What appears to be happening is that the vector instruction here, vpxor, is trying to load 128 bits (16 bytes) from 0x7FFB79FFFFF8. As a result, it’s reading 8 bytes from accessible, legally mapped memory, and trying to read the following 8 bytes from 0x00007ffb7a000000, which is inaccessible, unmapped memory. The result is that we get a SIGSEGV.
Let’s take a deeper look at RDI. The error log gives us as much information as it can about the data that resides in registers, in the “Register to memory mapping:” section:
Register to memory mapping:

RAX=0x0000000000000007 is an unknown value
RBX=0x0000000000000020 is an unknown value
RCX=0x00007ffb75418ce0 is an oop: [B
{0x00007ffb75418ce0} - klass: {type array byte}
- length: 32
RDX=0x000000000000001f is an unknown value
RSP=0x00007ff751956420 is pointing into the stack for thread: 0x00007ff7fbaa0000
RBP=0x00007ffb75417b40 is an oop: sun.security.krb5.EncryptionKey
{0x00007ffb75417b40} - klass: 'sun/security/krb5/EncryptionKey'
RSI=0x0000000000000019 is an unknown value
RDI=0x00007ffb79ffffc8 is an oop: [B
{0x00007ffb79ffffc8} - klass: {type array byte}
 - length: 32
R8 =0x0000000000000019 is an unknown value
R9 =0x0000000000000018 is an unknown value
R10=0x0000000000001f40 is an unknown value
R11=0x0000000000000019 is an unknown value
R12=0x00007ff751956900 is pointing into the stack for thread: 0x00007ff7fbaa0000
R13=0x0000000000000001 is an unknown value
R14=0x0 is NULL
R15=0x00007ff7fbaa0000 is a thread
It looks like the value in RDI is an ordinary object pointer (oop) which represents a byte array. What we seem to be seeing here is that the compiler has generated code that is either improperly indexing this byte array or is reading too much data from this address. If this was a write instruction, the error would likely be catastrophic, more frequently occurring, and probably would have been found and fixed a long time ago.
However, because it is a read instruction, this kind of error in the code can go unnoticed for a long time, as it does not produce an error in most cases (this is assuming that the code after this instruction operates only on the data it is supposed to operate on, without looking at the extra data that is read). A read becomes a problem, though, once it reaches into unmapped territory. In the case here, the data that this instruction operates on must be at the end of a region for it to be a problem. In most instances, this instruction will be operating on data away from the end of the region and everyone is blissfully unaware that it’s reading more than it should.
The thing that initially looks suspicious here is the repeated use of 0x18. It’s added twice, both from the contents of R9 and from the literal offset in the instruction. This makes us wonder whether the compiler is inadvertently adding an offset of 0x18 twice, pushing the address into territory it shouldn’t be in.
What’s Next?
In Part 3 of this series, we’ll look for a fix and/or a workaround for this issue. Stay tuned!
0 comments