


In our previous blog we introduced Azure Command Launcher for Java (jaz) —a safe, resource-aware way to launch the JVM without hand-tuning dozens of flags. This follow-up shares performance results, focusing on how jaz affects G1 behavior, heap dynamics, and pause characteristics under a long-running, allocation-intensive workload: SPECjbb 2015 (JBB).
Test bed: 4-vCPU, 16-GB Azure Linux/Arm64 VM running the Microsoft Build of OpenJDK.
JDKs exercised: Validated on JDK 17 (17.0.17), 21 (21.0.9), and 25 (25.0.1); all figures in this post are from the JDK 17 runs. Trends on 21/25 matched the 17 results.
How we ran it:
# baseline
java -jar specjbb.jar

# with jaz
jaz -jar specjbb.jarControls: Same JBB workload config, OS settings, and JVM flags for both runs—the launcher was the only change.
Why JBB Is the Right Stress Test
JBB exercises high allocation rate, object churn, humongous-allocation behavior, generational sizing, region pressure, concurrent-mark sustainability, GC scheduling, and pause-time predictability. Because it is both bandwidth-intensive and latency-sensitive, JBB is ideal for validating heap ergonomics and GC policies in the cloud.
As a capacity-planning tool it helps explore sustained throughput limits, GC headroom before SLA violations, warm-up behavior under load, and how a given VM size (4 cores, 16 GB) holds up under continuous allocation pressure.
Performance Summary: Baseline vs jaz
| Metric | Baseline | With jaz |
Improvement |
| Peak Throughput | Baseline | 22% | Higher max-jOPS |
| SLA Performance | Baseline | 15% | Higher critical-jOPS |
| Total GC Events | 3777 | 2526 | -33% (1251 fewer) |
| Young GC Count | 1100 | 1596 | +45% (handles higher load) |
| Mixed GC Count | 778 | 265 | -66% (513 fewer) |
| Young GC Overhead | 1.41% | 2.60% | Higher but efficient |
| Mixed GC Overhead | 0.96 | 0.39 | -59% reduction |
| Old Gen Pattern | Flat plateau (600-900) | Deep sawtooth (200-1000) | Dynamic sizing active |
Key Insight: jaz achieves 22% higher throughput by keeping Young GC efficient—objects die in Eden/Survivor instead of promoting prematurely to Old gen, dramatically reducing expensive Mixed GC work.
Baseline Behavior: Where the Wild Things Are
Microsoft Build of OpenJDK with default G1 GC ergonomics. Long JBB run on a 4-core VM.
Region Dynamics: Tight Band with Sustained Old Gen Plateau
- Collection cadence is crowded: Young promotes excessively to Old gen; Mixed GC runs continuously but can’t get Old occupancy down.
- Eden (before GC) sits in high, tightly bound band; each Young GC arrives with Eden already large.
- Old (after GC) settles into a crowded, high plateau (~600–900 regions) with a slight upward drift, indicating continued promotion pressure.
- Humongous-triggered Concurrent Start (markers labeled Humongous) denote very large allocations that force a new concurrent marking cycle. They appear clustered, intermittent and align with heavier Old gen activity.
GC Pause Envelope: Heavy Mixed GC Response to JBB Phase Shifts
- Young pauses (teal): early noisy cluster (spikes ~300 ms), then a long, flatter band around ~80–130 ms; moderate variance as Eden fill → evacuate → refill repeats.
- Overlay (Concurrent-Start (magenta) + Prepare-Mixed (gray) + Mixed (blue)): the combined envelope includes the magenta points (Concurrent Start) followed by effectively continuous periods of Prepare/Mixed (~50–150 ms with occasional higher outliers) and dense bands. Old gen’s elevated plateau drives frequent concurrent cycles and Mixed activity.
With jaz: Beyond the Wild Rumpus
Same VM/JDK/workload; only the launcher changed (jaz resource-aware defaults).
Region Dynamics: Dynamic Sizing with Dramatic Old Gen Sawtooth
- Handling higher throughput:
jazachieves 22% higher max-jOPS, driving higher allocation rate. Both Eden and Old show dramatic oscillation (200-1000 regions) – wider variation reflects increased load and dynamic heap sizing, not the tight bands of baseline. - Eden (before-GC): Wider oscillation reflects the higher allocation rate from increased throughput; dynamic sizing adapts to load.
- Old (after-GC): Dramatic sawtooth pattern is the key insight:
- Deep troughs (~200 regions): Mixed GC efficiently reclaims Old gen, bringing occupancy down to minimal levels
- Gradual rises (200 → 1000): Steady, controlled promotion over many cycles
- Sharp drops: Mixed cycles reclaim aggressively, restoring headroom for next load phase
- Humongous-triggered Concurrent Starts: rare and isolated, most avoiding Old gen spikes tied to large allocations.
GC Pause Envelope: Narrow and Predictable Early
- Young pauses (teal): Wavy pattern with periodic oscillations ~15–250 ms; working to handle the increased throughput load.
- Key insight: Higher Young GC frequency (1,596 vs 1,100) keeps pace with the higher allocations and ages objects in the Young gen where collection is cheap, preventing premature promotion to Old gen
- Overlay (Concurrent-Start (magenta) + Prepare-Mixed (gray) + Mixed (blue)): Shows the episodic nature clearly:
- Concurrent Start begins marking cycle (114 events vs baseline’s 439)
- Cleanup (which precedes Prepare-Mixed) finalizes old-region candidates
- Prepare-Mixed transitions to Mixed GC phase
- Mixed pauses reclaim old regions aggressively when needed
- Overall pattern: Young GC works harder (2.60% overhead vs 1.41%) but keeps promotions low, resulting in 59% less Mixed GC overhead (0.39% vs 0.96%).
Side-by-Side: Baseline vs jaz
Region Dynamics — Before GC (Eden)
Fig 1 vs Fig 2. Comparison: Baseline shows tight, stable Eden band (700-900 regions). jaz shows wider oscillation because it’s handling 22% higher throughput—increased allocation rate from higher max-jOPS.
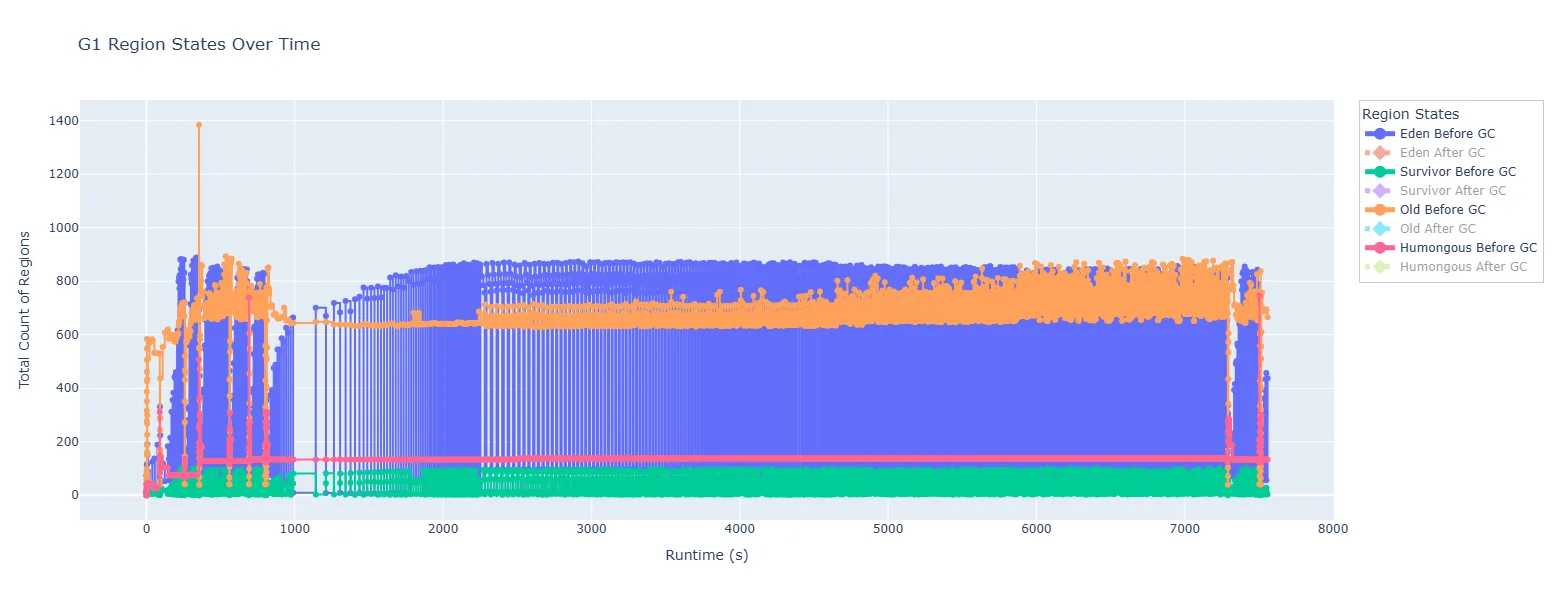
Figure 1: G1 Region States Over Time — Before GC (baseline)

Figure 2: G1 Region States Over Time — Before GC (withjaz)
Region Dynamics — After GC (Old)
Fig 3 vs Fig 4. Comparison: Baseline keeps Old gen at elevated plateau (600-900 regions) continuously. jaz‘s dramatic sawtooth (200-1000 regions) proves efficient Mixed GC reclamation—deep troughs demonstrate productive old gen cleanup, restoring headroom. Result: 265 Mixed GCs vs 778 (−66%) despite 22% higher throughput.
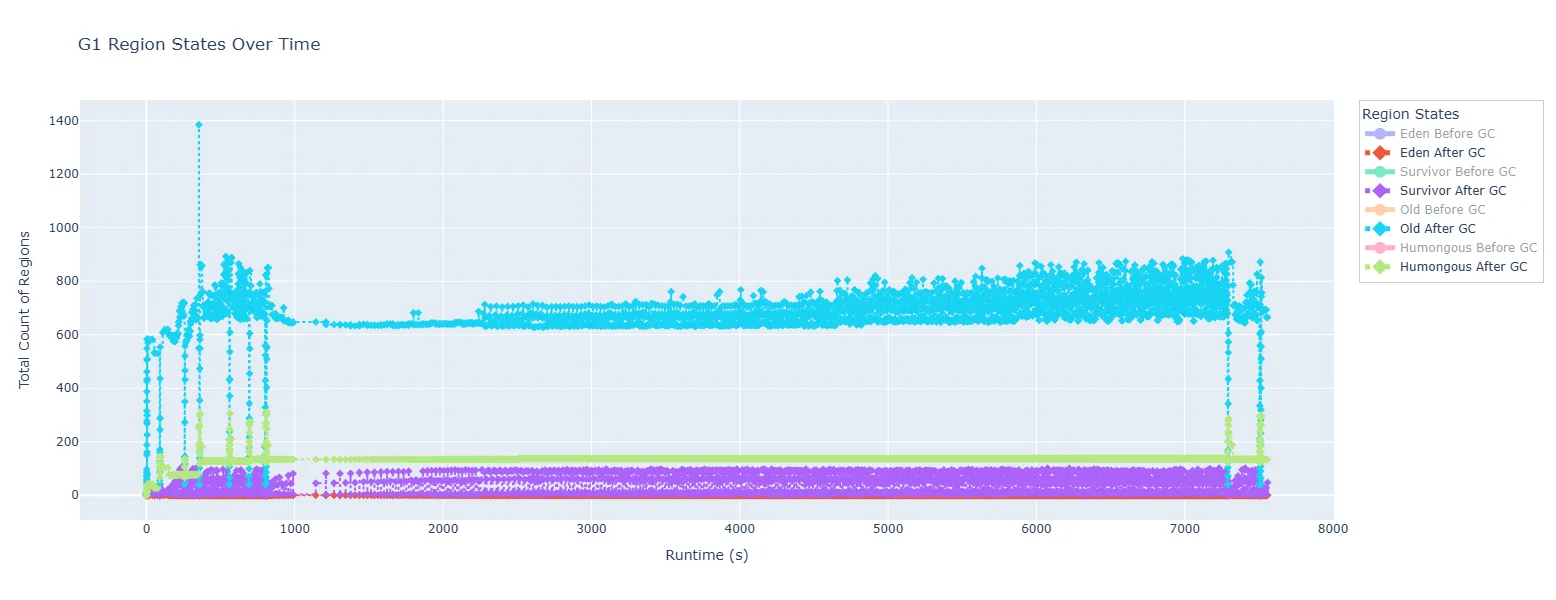
Figure 3: G1 Region States Over Time — After GC (baseline)
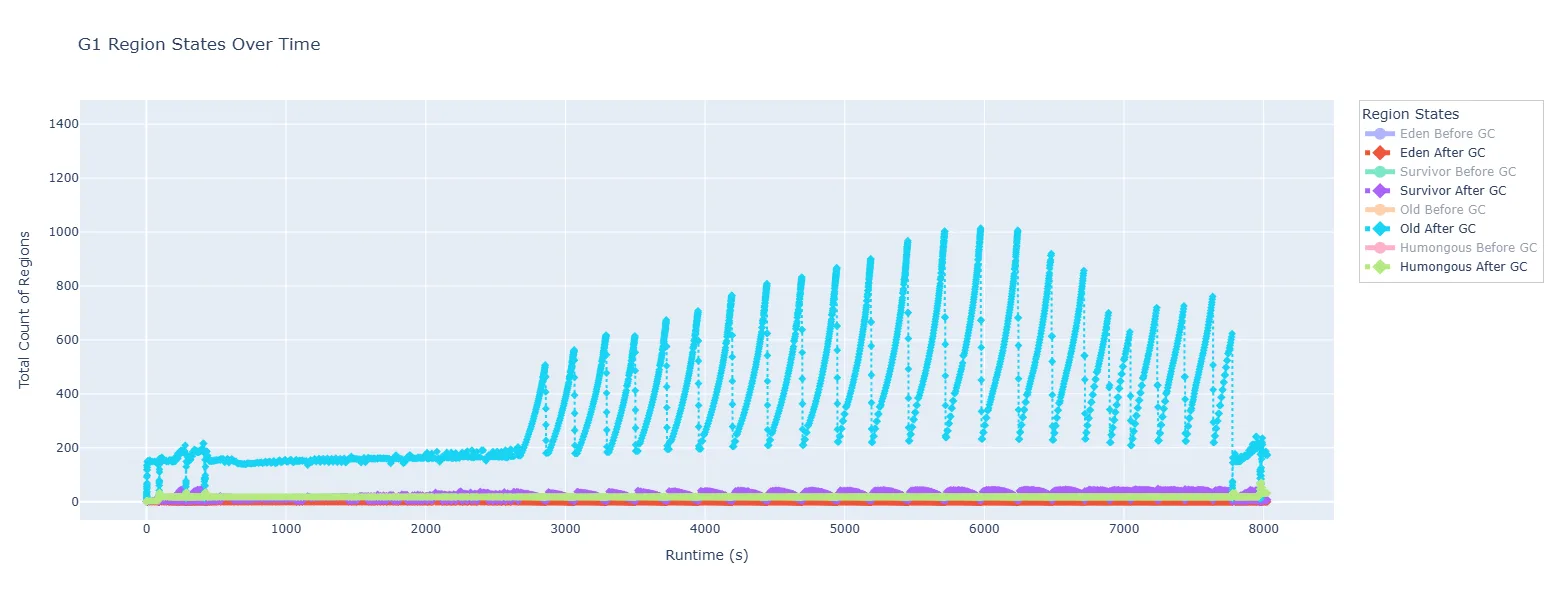
Figure 4: G1 Region States Over Time — After GC (with jaz)
GC Pause Envelope — Young
Fig 5 vs Fig 6. Comparison: Baseline shows 1,100 Young GCs with early spikes then ~80-130ms band. jaz shows 1,596 Young GCs (+45%) with wavy pattern ~15-250ms. More Young GC activity is positive—it’s handling 22% higher throughput while keeping objects from promoting prematurely.
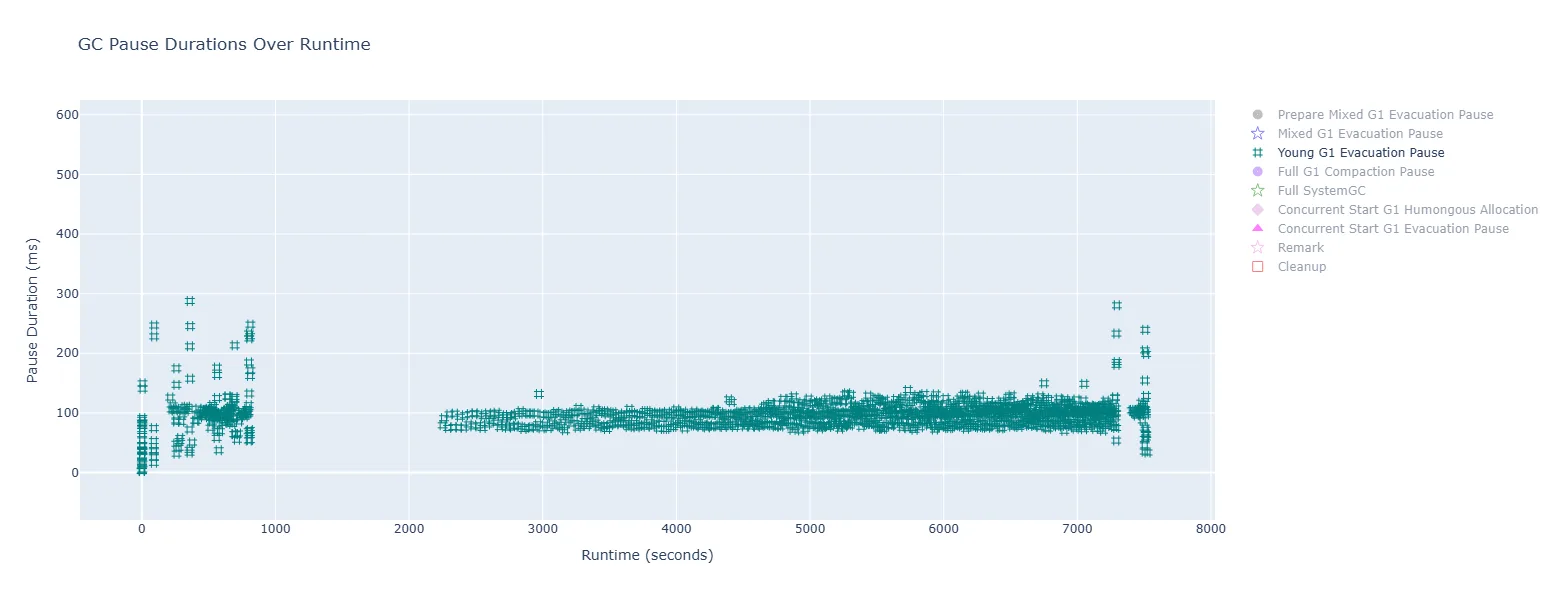
Figure 5: Young-only pauses (baseline)
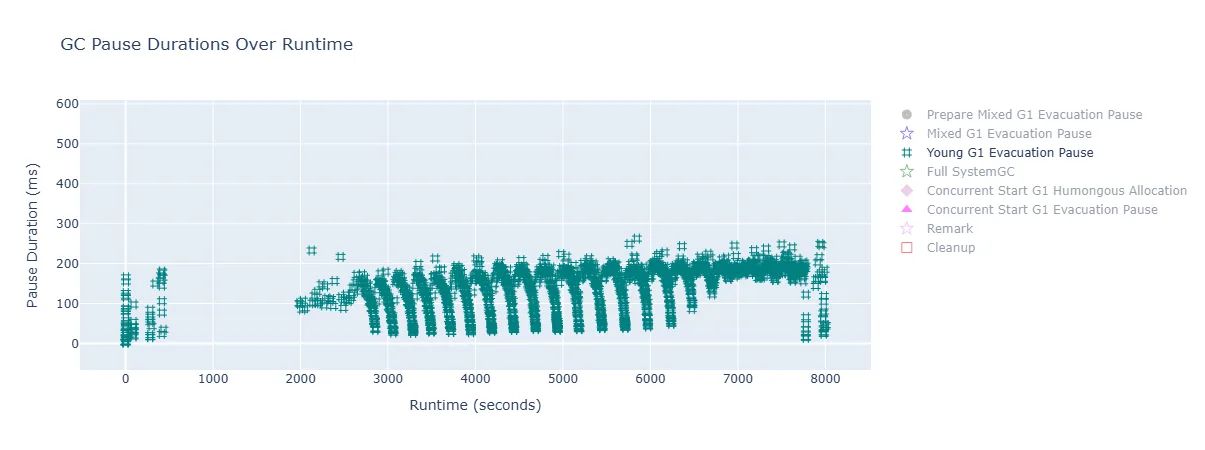
Figure 6: Young-only pauses (with jaz)
GC Pause Envelope — Overlay (Concurrent Start + Prepare-Mixed + Mixed)
Fig 7 vs Fig 8. Comparison: Baseline shows dense, continuous Mixed activity (778 events) driven by Old gen’s elevated plateau. jaz shows episodic pattern with quiet stretches (265 events = −66%)—efficient GC prevents Old gen buildup proactively, resulting in 59% lower Mixed overhead.
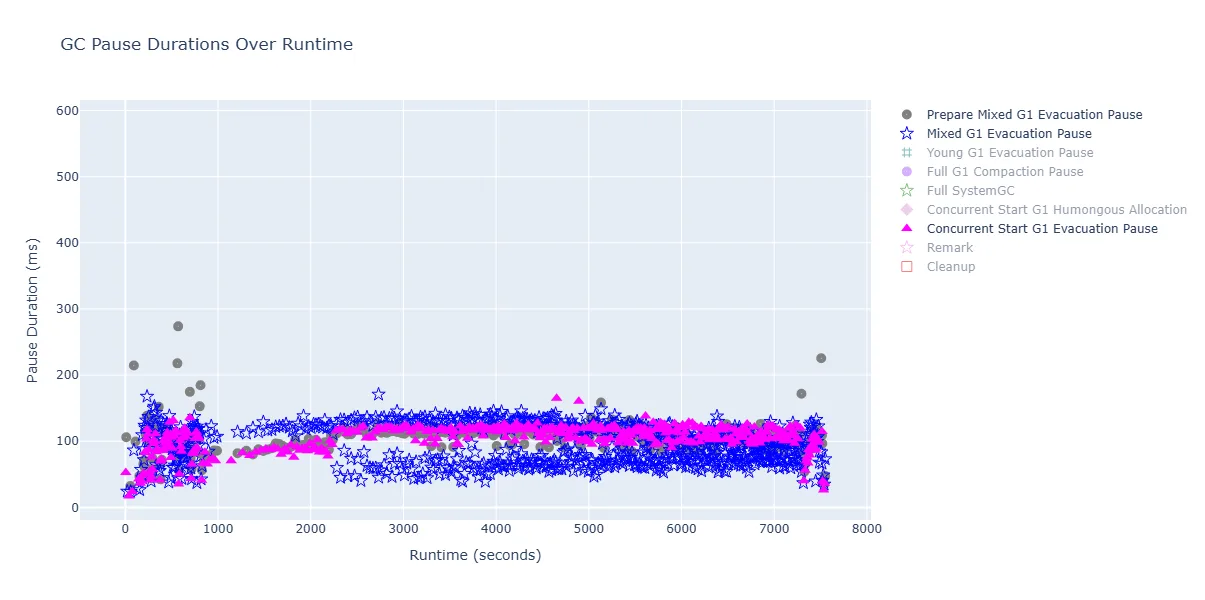
Figure 7: Prepare-Mixed + Mixed pauses with Concurrent Start overlay (baseline)
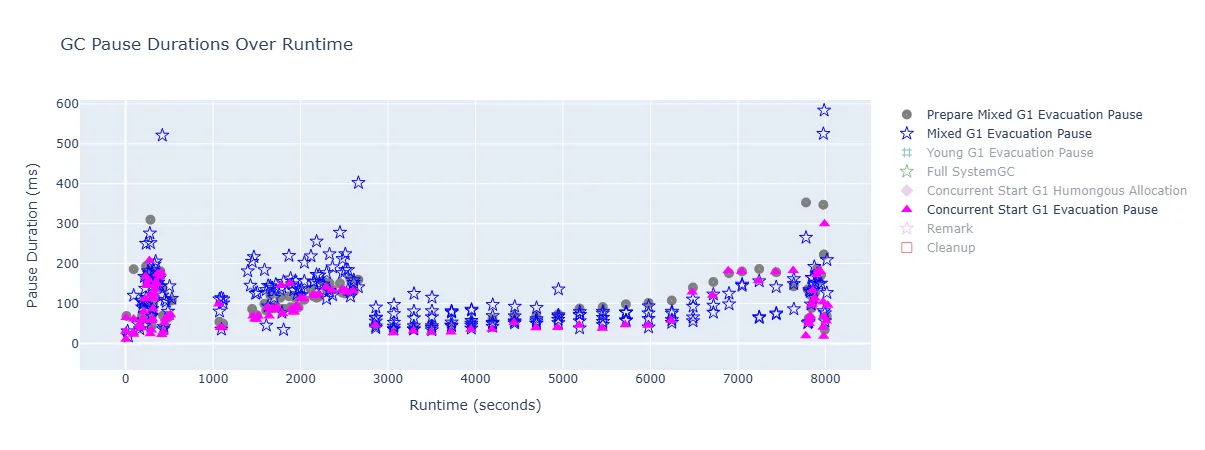
Figure 8: Prepare-Mixed + Mixed pauses with Concurrent Start overlay (with jaz)
GC Pause Envelope —Humongous Starts Concurrent Marking
Fig 9 vs Fig 10. Comparison: Baseline shows clustered Humongous Starts Concurrent Marking events at warm-up and tail. jaz shows only ~10 isolated events—large allocations are absorbed avoiding humongous-triggered marking, post-marking and Old gen pressure.
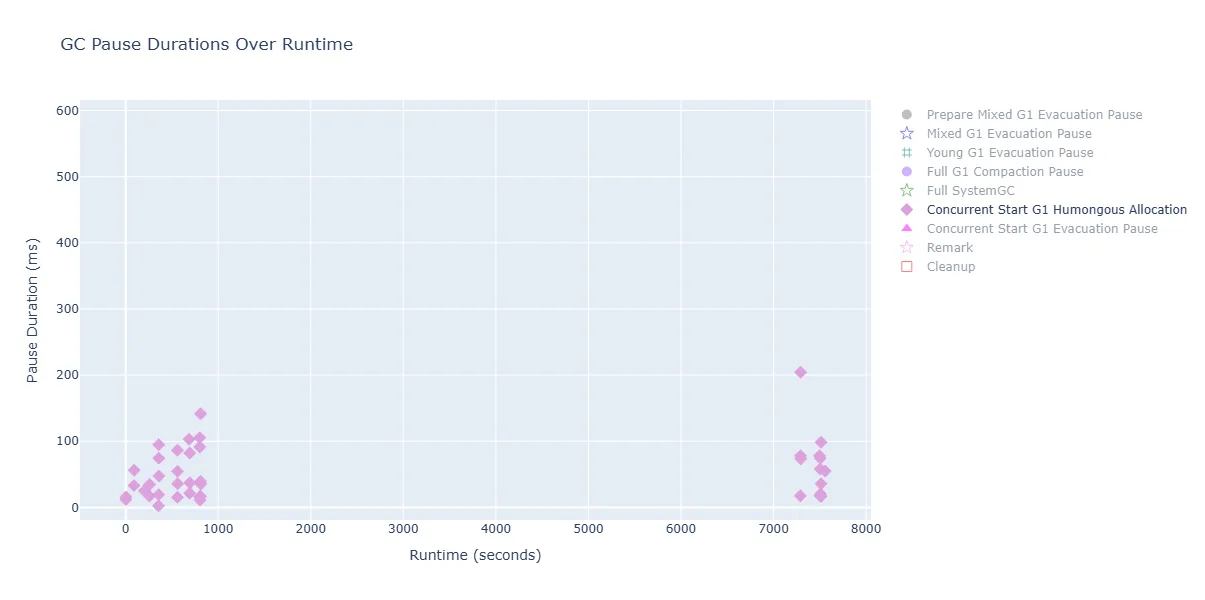
Figure 9: Humongous-trigger events (baseline). Early and tail clusters align with mixed-GC activity
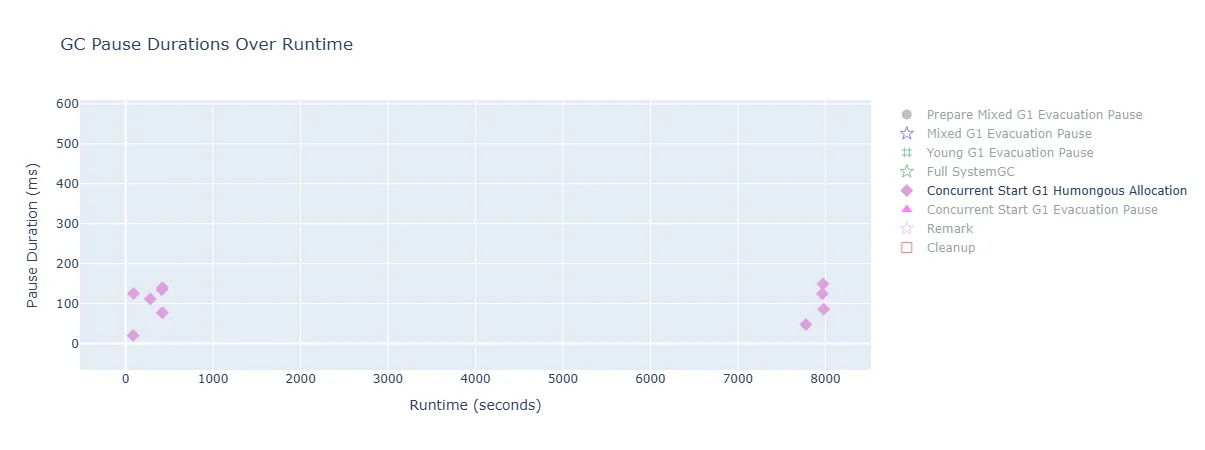
Figure 10: Humongous-trigger events (with jaz)—rare, non-disruptive
Comparison Matrix
| Aspect | Baseline | With jaz |
What Changed |
| Throughput | Baseline | jaz |
+22% peak throughput
+15% at SLA |
| Total GC Events | 3,777 cycles | 2,526 cycles | −33% (1251 fewer events) |
| Regions: Before GC (Eden)
Fig. 1 → Fig. 2 |
Tight band (~700-900 regions)
Eden already large at Young GC arrival |
Wider oscillation
Reflects higher allocation rate |
Handling 22% more work
Dynamic sizing active |
| Regions: After GC (Old)
Fig. 3 → Fig. 4 |
Flat plateau (~600–900 regions)
Always elevated |
Dramatic sawtooth (~200–1000 regions)
Deep troughs restore headroom |
Efficient Young GC keeps promotions low
Old cleanup prevents buildup |
| Young GC Count
Fig. 5 → Fig. 6 |
1,100 events
1.41% overhead |
1,596 events (+45%)
2.60% overhead |
More Young GC is good—handles higher throughput
Handles transients efficiently in the Young gen |
| Mixed GC Count
Fig. 7 → Fig. 8 |
778 events
0.96% overhead Continuous pattern |
265 events (−66%)
0.39% overhead (−59%) Episodic pattern |
Massive reduction in Old gen work
Cadenced GC prevents reactive storms |
| Humongous Events
Fig. 9 → Fig. 10 |
41 clustered bursts at warm-up and tail | ~10 isolated events Sparse, absorbed | Large allocations don’t trigger excessive marking cycles |
Baseline Implications
In baseline, Young GC dump large volumes of live data to Old gen. Premature promotions lead to continuous Mixed GC work. Old then stays high, thresholds trip early and often, and Mixed/concurrent activity becomes dense. JBB hits the system throughput ceiling early.
- High stop-the-world (STW) frequency across phases: Young dominates count; Mixed/Prepare are effectively continuous once load stabilizes—no long quiet stretches.
- Premature promotion tax: 2677 Concurrent Starts, Remark, Cleanup, Prepare-Mixed and Mixed GC events represent continuous Old gen collection work.
- Pattern: Stable but limited—GC keeps up with load but cannot scale to higher throughput. G1 is catching up, not cruising.
The jaz Breakthrough: Efficient Young GC Enables Higher Throughput
jaz achieves 22% higher peak throughput through resource-aware defaults that provide the capacity to handle increased load, combined with efficient GC that keeps it sustainable.
How jaz Works
- Resource-aware defaults provide capacity for higher throughput:
- Larger heap sizing based on available VM memory (16 GB)
- Dynamic heap management adapts to load phases
- More Eden headroom → can handle higher allocation rate from increased operations/sec
- Result: System can sustain 22% higher max-jOPS without choking on memory pressure
- Efficient Young GC keeps it sustainable:
- 1,596 Young GCs vs baseline’s 1,100 (+45% more cycles)
- 2.60% overhead vs 1.41% (+1.19 percentage points)
- But: Handling 22% higher throughput—more work per unit time
- Objects die in Eden/Survivor instead of promoting to Old
- Dynamic sizing + cadenced GC maintain headroom:
- Creates breathing room for episodic Mixed GC to reclaim aggressively
- Prevents Old gen buildup, avoiding continuous Mixed GC tax seen in baseline
- Sawtooth pattern shows efficient heap usage: expand → promote → reclaim → repeat
- Result: Old gen sawtooth drops to ~200 regions (vs baseline’s 600-900 plateau)
jaz Takeaways
- 22% higher peak throughput:
jazscales where baseline hits ceiling - 15% better SLA performance: steadier latency under load
- 66% fewer Mixed GCs: 265 vs 778 events—massive reduction in expensive Old gen work
- 33% fewer total GC events: 2,526 vs 3,777 cycles despite handling more work
- Efficient Young GC strategy: More Young cycles (1,596 vs 1,100) but keeps promotions low
Conclusion: jaz Unlocks Higher Throughput on Azure VMs
This performance study shows that jaz is more than a convenience wrapper—it’s a resource-aware optimization pipeline that delivers measurable, significant improvements in real-world workloads:
- Sizes heap and generations appropriately, avoiding reactive warm-up churn.
- Stabilizes early GC behavior, tightening pause bands sooner.
- Reduces humongous-triggered marking moments, easing Mixed-GC pressure.
- Maintains GC cadence as load steps up, preventing premature promotions and high plateaus.
- Lifts overall throughput/SLA metrics—with the launcher as the only change.
On Azure Linux/Arm VMs with the Microsoft Build of OpenJDK, jaz consistently delivered:
- Faster warm-up
- Higher sustained throughput
- Lower p99 response-time tails
- Tamed Old gen that repeatedly returns to a low post-GC watermark
What’s Next
We’re extending jaz beyond a great default into a continuously adaptive launcher:
- JVM configuration profiles: pre-vetted, resource-aware profiles for common VM and container shapes.
- Continuous tuning: light-touch runtime feedback to stay stable under shifting pressure—no app changes.
- Telemetry: opt-in summaries that inform on-the-fly decisions and explain “why `
jazchose X.” - AppCDS: optional archive generation/consumption to shorten warm-up and smooth early allocation/JIT behavior.
- Leyden alignment: play nicely with Leyden’s startup/profile optimizations so
jazcan pick the right combo per workload.
Stay tuned—jaz is becoming a foundation for self-optimizing Java runtimes on Azure.
Appendices
Appendix A — Test Environment Preparation & Methodology (Reproducibility)
To ensure clean, comparable results across baseline and jaz runs, each iteration followed this protocol.
Cache Reset Per Run
sync                                # force pending disk writes
echo 3 > /proc/sys/vm/drop_caches   # drop page cache, dentries, and inode caches
We reset Linux page cache before each trial to remove cross-run noise from warm caches. drop_caches does not discard dirty data; sync persists it first. (Run as root / via sudo.)
Repeated Trials
Both configurations (baseline vs jaz) were executed multiple times across Microsoft Build of OpenJDK versions. Runs showed highly consistent GC behavior, region-state evolution, and throughput trends.
Appendix B — From JBB Phases to GC Pauses
JBB is a complex tool designed to simulate a 3-tier system and measure the performance of the JVM on a given OS + hardware. A full run cycles through several distinct operational phases, each with unique performance and memory characteristics that are crucial for performance engineers to understand for effective tuning. Let’s get a quick look at how JBB phases shape allocation/promotion pressure.
How JBB Drives Load and GC (Phase Guide)
Why this matters: JBB pushes the JVM through distinct load phases that shift allocation and promotion pressure. Understanding these phases helps when analyzing GC logs or perf telemetry, because JVM behavior changes dramatically from startup to peak load and final shutdown.
Phase 1: Warm-up / HBIR Search
This initial phase is all about getting the system ready and estimating capacity.
- Activity: Threads come online, the JVM performs JIT compilation, and profiling begins. The benchmark searches for the High Bound Injection Rate (HBIR), a preliminary estimate of the maximum throughput.
- Memory behavior: This phase is characterized by high bursts of object allocation and moderate, but rising, promotion pressure as the app code is loaded, initialized, and begins processing initial transactions.
Phase 2: The RT-Curve Build
This is the core measurement phase where the benchmark systematically increases the load to build the Response-Throughput (RT) curve.
- Activity: The load (Injection Rate or IR) increases stepwise. Performance metrics are rigorously collected at each step.
- Memory behavior: The system experiences sustained and rising allocation pressure. More transient (short-lived) objects are created, and the promotion pressure increases significantly as the system approaches maximum capacity.
The Relationship Between jOPS and Memory Pressure
- Higher throughput ⇒ higher allocation rate: jOPS counts ops/sec; more ops create more objects per unit time.
- Promotion pressure rises with load: to sustain higher IR, GC runs more often; survivors are promoted to Old sooner.
- The memory subsystem must handle this churn without excessive pauses or fragmentation.
- Key SPEC metrics:
- max-jOPS — highest throughput at the last successful IR level before the first RT-curve failure.
- critical-jOPS — geometric mean of jOPS at p99 response time across five SLA points (10, 25, 50, 75, 100 ms).
Phase 3: Validation / Tail
The final phase winds down the benchmark run and validates the data collected.
- Activity: The run concludes with report/validation segments following the RT phase.
- Memory behavior: Allocation pressure tapers; promotion pressure declines which is typical of a ramp-down in workload.
Appendix C — GC Cheat Sheet (Quick Primer)
Overarching GC goal
Get out of the way — maximize mutator time, keep pauses predictable and short, avoid premature promotion/copying, and reclaim promptly.- Eden: where most new objects are born. It fills quickly and is emptied during Young (and later Mixed) GCs.
GC goal
Keep Eden large enough that most short-lived objects die there, but not so large that evacuations must copy a big live set, overflow Survivor or force premature tenure. - Survivor: short-term holding for objects that just survived a Young GC (they “age” here).
GC goal
Let objects age briefly and avoid premature promotion to Old. - Old: promoted medium/long-lived objects. Growth here drives Mixed GCs.
GC goal
Keep only the long-lived live data set (LDS); minimize promotion churn and lower region waste/fragmentation. - Humongous: very large objects (≥50% of a region) allocated directly into Old as one or more contiguous humongous regions, bypassing Young.
Gotcha
Short-lived/bursty humongous allocations can fragment Old or force extra GC/cycle work to find contiguous space; reclaiming them eagerly is key.
Appendix D — What the Figures Show (Baseline, jaz)
Region Composition Over Time
These plots count regions by role and reveal how the regions react across JBB phases.
- Fig 1–3 (baseline): Before GC, After GC
- Fig 2–4 (
jaz): Before GC, After GC
“Before GC” = right before a collection (peaks). “After GC” = immediately after (valleys).
Pause-time Envelope (STW Pauses Over Time)
These plots show frequent STW events across the run, with variance shifting as JBB moves through Warm-up → SLA → Tail.
- Young (teal): Fig 5 (baseline), Fig 6 (
jaz) - Overlay (Concurrent-Start + Prepare-Mixed + Mixed markers): Fig 7 (baseline), Fig 8 (
jaz) - Concurrent-Start due to humongous allocation (diamond markers): Fig 9 (baseline), Fig 10 (
jaz)
Each dot is an STW pause (y-axis = ms, x-axis = runtime (s)). These pairings let you compare pause frequency/ceilings and variance shifts across the same JBB phases.
Note on Remark/Cleanup
These are short closing STW phases of a concurrent marking cycle. Remark finalizes marking bookkeeping while Cleanup tidies metadata and remembered sets and completes any leftover work before the next Mixed GCs begin. Once marking stabilizes, they’re typically tiny and flat in these runs, so we omit separate plots for brevity.
0 comments