The upcoming version of Visual Studio introduces a number of improvements focused on diagnosing your Web Applications. One of these is the new Page Inspector.
Page Inspector is a new tool that brings browser diagnostics tools into Visual Studio and provides an integrated experience between the browser, ASP.NET, and source code. Using Page Inspector, you can inspect elements in the integrated browser and see exactly which file and lines of code generated that element (HTML literal content and server-side code). It also comes with a DOM Visualizer and CSS Tools in which you can modify the properties and see the changes in the browser in real time.
Decomposing a Web Page (Source Code Selection Mapping)
Page Inspector provides an Inspect mode that you can toggle by clicking the ![]() icon. When Page Inspector is in Inspect mode, you can hold the mouse pointer over elements in the web page, and Page Inspector shows you the following:
icon. When Page Inspector is in Inspect mode, you can hold the mouse pointer over elements in the web page, and Page Inspector shows you the following:
- Range selection in the source file that generated the HTML element (for non-dynamically generated elements).
- Visual feedback on the web page for the element.
- Visual representation of the element in the page’s DOM tree.
- CSS properties for the element.
This gives you a complete picture of where in the source the HTML element was generated and what that element will look like in the live browser, instead of trying to figure out which file was responsible for rendering the markup. Inspection mode provides the easiest way to decompose and map from the browser to source files.
Selecting CSS Rules
Most browser tools provide a sandboxed environment for HTML and CSS where you can change values, and the browser automatically reflects the changes. However, the changes are not persisted and the original source files are unaffected.
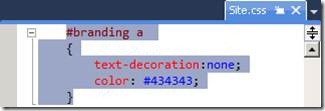
To bridge this gap, Page Inspector provides CSS mapping capabilities at the rule level. Clicking rules in the CSS tools grid opens the .css file in which the rule is defined and selects the complete rule. This makes it easy for you to get to where the rule is defined.
Viewing Projects and Websites in Page Inspector
Page Inspector takes all the steps that are required in order to let you view the output of a Visual Studio web project (Web Application project or Web Site project). These steps can include:
- Building the project.
- Starting IIS Express.
- Navigating the Page Inspector browser to the site.
Any of the following actions launches Page Inspector:
- Clicking the Page Inspector Home button. This opens the Page Inspector browser and displays the project’s root.

- Pressing Ctrl+K, Ctrl+G in the editor. This action opens the Page Inspector browser and displays the currently active document.
- In the editor, right-clicking a file and choosing View in Page Inspector. You can also use this command by right-clicking a file in Solution Explorer.
Using the Files Pane to View Source Pages
You will be able to see a complete list of all the files that together compose the current web page. When you are working with a complex site, you can use this feature to visualize the files that were used for building a particular WebPage.
Mapping Files to URLs
Routing lets you map URLs to files. However, there is no file-to-URL mapping. Today if you want to see a specific file in the browser, you often have to reverse-engineer the existing routes, and possibly try different route parameters, in order to cause the application to respond with the file you want to see.
Page Inspector tries to construct a URL based on convention and navigate in the browser so that there is a one-to-one mapping between a file and a URL. There can be cases where the resulting routing will not result in the expected file or where invoking the View in Page Inspector command results in a file that shouldn’t be served (like a user control, partial view, or master page). In those cases, the tool still requires some level of URL mapping. Page Inspector will understand these cases and will prompt you to manually enter a URL (relative or absolute) that can be mapped to the requested file.
Updating the Page View in the Browser
Page Inspector is aware of all the different files that compose the current page, and it can detect when any of these files change. It alerts you whenever the current page in browser is not in sync with the source files.
The site might be out of sync for many reasons. For example, you might have changed page code, changed a code component in the site, or changed a .css, .js, or HTML file. Page Inspector alerts you when it detects a change, and you can click the bar or press Ctrl+Alt+Enter. Page Inspector then performs whatever actions are required (for example, rebuilding the project or restarting IIS Express) and shows you the latest version of the file.
Enabling Page Inspector’s selection mapping
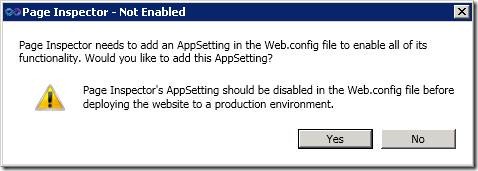
To generate the metadata that’s required for some of its features, Page Inspector must instrument the project by adding the following setting to the <appSetting> element in Web.config file:
<add key="VisualStudioDesignTime:Enabled" value="true" />
When Page Inspector needs to make this setting, you are prompted so that project files are not changed without your consent. (This is similar to the message you see if Visual Studio needs to set debug mode in the Web.config file.)
You can use Page Inspector even with this setting disabled or missing. However, some features will not work, such as source selection mapping.
Known Issues
- Docking location. Page Inspector should be docked in the tool window areas of the document. If you dock it elsewhere, documents might open on top of the Page Inspector window.
- Page Inspector width is small when first launched. This was done so that the default docking location is in the tool window area.
- Internet Explorer 9 is required. The Page Inspector browser tools require Internet Explorer 9 or later to work correctly.
- ASP.NET WebPages 1 is not supported. Currently, Web Pages 2 and Web Forms in ASP.NET 4.5 are the only view engines that are supported.
- Quirks mode not supported in Inspect mode. Web pages in the browser must be displayed in Internet Explorer 9 standards mode. If Quirks mode or an older standards mode is used, the browser tools will not work correctly.
- Backspace issues. When the browser tools have focus, pressing Backspace might deactivate the tools. To fix this issue, refresh the browser or navigate to a different page.
Download Page Inspector
- Download through the Web Platform Installer – http://go.microsoft.com/fwlink/?LinkID=227946
- Release Notes – http://go.microsoft.com/fwlink/?LinkID=227938
- Visual Studio 11 Developer Preview: http://msdn.microsoft.com/en-us/vstudio/hh127353
Software Requirements
Page Inspector Developer Preview requires the following software installed on your computer:
- The .NET Framework version 4.5
- Visual Studio 11 Developer Preview
- Internet Explorer 9 or later.
- Targetting WebForms or Razor v2
Feedback Needed
Page Inspector is still in its early stages and we would like to hear from you!
- Comments and suggestions can be added in the comments sections
- Feature requests can be logged in our UserVoice website
Jorge Gabuardi Gonzalez
Web Platform and Tools

![clip_image002[5] clip_image002[5]](https://devblogs.microsoft.com/dotnet/wp-content/uploads/sites/10/2011/09/1067.clip_image0025_thumb.jpg)


![clip_image002[7] clip_image002[7]](https://devblogs.microsoft.com/dotnet/wp-content/uploads/sites/10/2011/09/7870.clip_image0027_thumb.jpg)


0 comments