
Sometime ago, we announced that the cloud-based load testing service in Visual Studio Team Services could be used to run Apache JMeter based load tests. We are happy to let you know that this feature is now publicly available and you can try it out using your Team Services account.
This is a quick how-to to help you get started.
Essentials: How to run Apache JMeter tests
-
Create a JMeter based load test for your app using the Apache JMeter IDE.
-
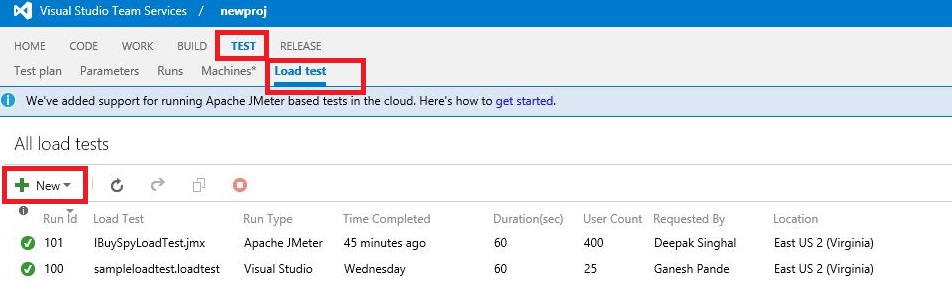
In the Team Services portal, navigate to your team project. Under the “Test” hub, you will see “Load Test”. Click on “New” in the ribbon and select Apache JMeter test.
-
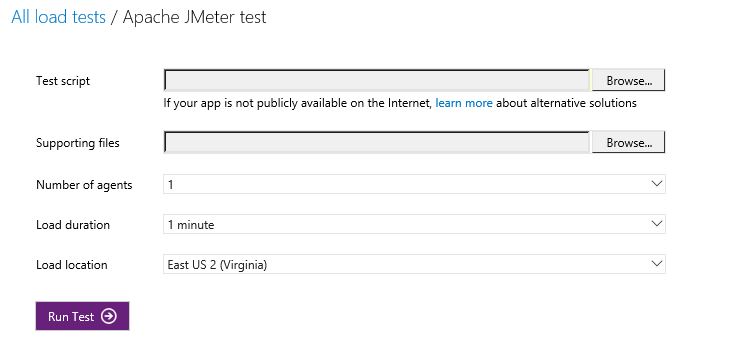
Upload your JMeter test (a .jmx test script).
-
Upload any supporting files that are required for running load tests – for e.g., csv files that might be used to data-drive a test, a user.properties file, etc.
-
Number of agents is the scaling factor. Your JMeter test will be replicated across the number of agents you specify and accordingly the load will be multiplied. For example, if the total number of threads in your JMeter test is 50 and you select 5 agents, your app will be hit with requests using 250 threads. More agents will be available in the future to generate a higher load.
-
Load duration – you can run a small test (a few minutes) to validate your configuration or a long one (upto 4 hours). In the future, we will enhance this to support longer tests.
-
Load location – you can choose to generate load from different locations around the globe. Pick a location that represents the geography from where you expect traffic to your application.
Results and reports
-
As your test runs, a live report will be available to you indicating key metrics such as Avg. response time, user load, RPS, etc, as well as charts for performance and throughput.
-
Any errors that may occur in your test such as failed requests, exceptions, etc. can be viewed in the Diagnostics tab.
-
Once the test finishes you get to view the top 5 slowest requests, and results (.csv format) and logs become available for download.
4. Have a favorite listener that you use to analyze results in the JMeter IDE? Open the results.csv in the listener and analyze away!
Contact
For any issues or queries, please contact us at vsoloadtest@microsoft.com
FAQ
1. What is the supported JMeter version?
A1: Our load test agents run Apache JMeter version 2.13, the latest version available currently.
- Which samplers are supported?
A2: Currently, only HTTP samplers are supported.
- I want to supply properties to JMeter. How do I do that?
A3: Add the properties you need to a user.properties file. Upload it using the “Supporting files” field and it will be applied when the load test runs.
- Are custom listeners supported?
A4: Custom listeners are currently not supported.
4. How is my load test’s usage calculated? What are VUMs?
A1: A load test’s usage is measured using VUMs or virtual-user minutes. It is based on the load generated (virtual users) and the duration of the test. 1 virtual user corresponds to 1 thread for JMeter. For minimum usage applied and other considerations, see this link
- What else can I do with cloud-based load testing?
A5: Apart from running JMeter tests using Cloud Load Testing, you can run:
- A simple load test – just provide your app URL and run a test. No other tools are necessary!
- Visual Studio based load tests – build a load test using Visual Studio Enterprise and run them on-cloud or on-premises.
0 comments