Visual Studio 2013 Update 2 introduced several exciting changes for mobile development. You are now able to use the same programming model that you use to build Windows Store apps for Windows 8.1, to build XAML apps Windows Phone 8.1.
In this post, I will remind you of the most important diagnostic capabilities that you will know from Windows Store apps development, that now apply to Windows Store apps on Windows Phone 8.1. You can find many existing Store App resources from the Windows Dev Center.
Debugging Features
Windows Store apps: Process Lifecycle Management (PLM)
Suspend, Resume, and Suspend and Shutdown App Model
Windows Store apps have several execution states that it can be running under. You can read more details about it from the Application Lifecycle MSDN documentation
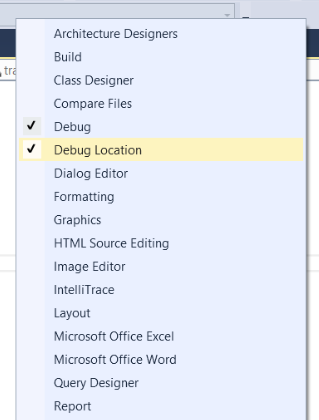
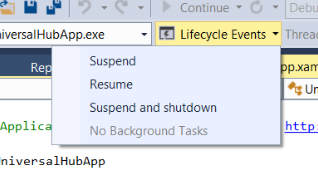
While programming your app, you may want to take these state changes into consideration for your app’s design. To test the functionality, you can trigger these state changes from Visual Studio using the Debug Location Toolbar.
1. While debugging, right click and select Debug Location from the list of toolbars.
2. Select the Lifecycle Event to trigger from the dropdown
Managed/Native Async Callstacks
Async calls aggregate together in the callstack window
Our blog post about using the callstack window to debug async code elaborates more about how to use this. Following the example illustrated in the linked blog entry, you can see that async calls are shown in the Call Stack window.
Managed/Native Async Tasks
See detailed information on Async Tasks in the Tasks Window
You are also able to see all async tasks that have been awaited in the Tasks window. You can learn more about asynchronous calls and how to debug them from our blog post.**
.NET Return Values
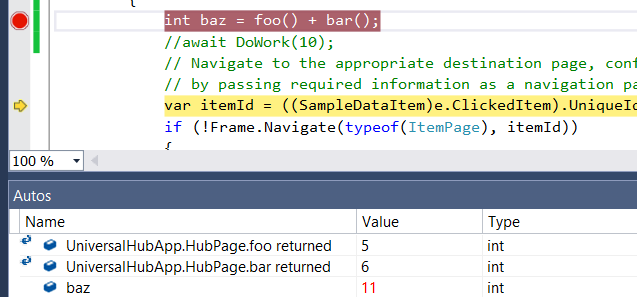
Return values for functions shown in the Autos Window
This functionality was introduced in Visual Studio 2013 for .NET projects. Now for phone .NET projects, you will also see return values of functions referenced on the current and previous line.
Phone Save Dump As
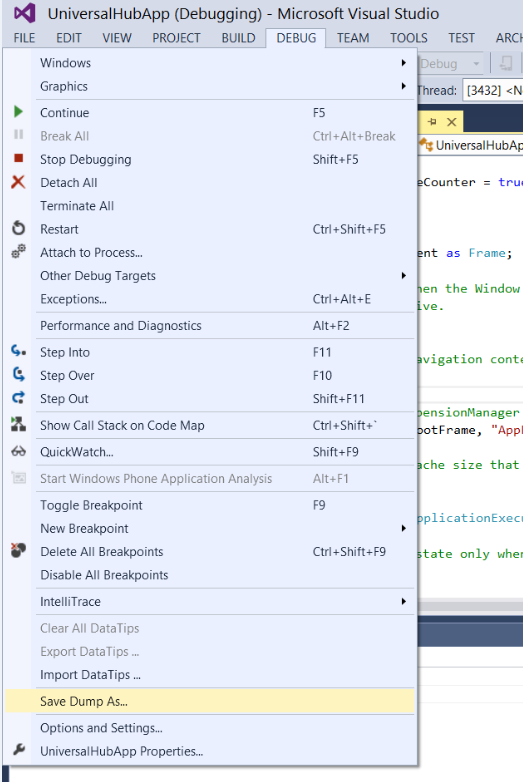
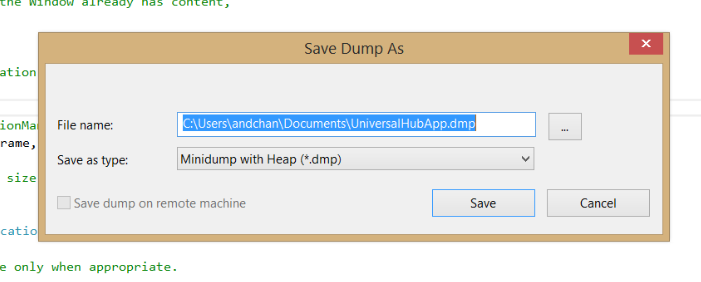
Create minidumps with heap from a Phone app
While stopped in the debugger, you can grab a minidump or a minidump with heap of your app. A minidump captures the current state (like a crash) and is extremely useful for sharing an issue to another member of your team. The heap information is useful for running memory analysis of your app to find and diagnose memory issues.
Phone .NET Dump Debugging
Debug crash minidumps and perform memory analysis on heaps
Using the minidump captured from Save Dump As or from a crash report, you are able to open that dump in Visual Studio to debug. Using a minidump with heap, you are also able to inspect the memory snapshot of your app to diagnose memory leaks and other memory issues. You can learn more about how to utilize dump debugging to diagnose memory issues in our blog.
Managed/Native Interop Debugging
Stepping between Managed and Native boundaries works with a interop debugger
WWA Debugging – Html/JS Windows Store App
Basic debugging support for Html/JS Store apps
Web Application Debugging to Phone/Emulator
Diagnose mobile websites on the phone or emulator
Profiling Tools
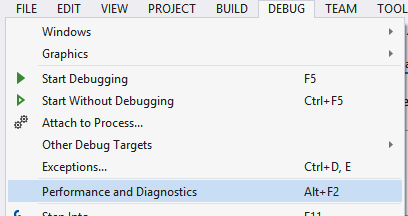
Profiling tools are used to help discover and fix performance issues like a slow or unresponsive app. These tools are found under the Performance and Diagnostics (Alt-F2) found under the Debug or Analyze menu. Haseeb Ahmed has posted a comprehensive post about Phone Profiling for a more detailed overview.
-
CPU Usage
-
The CPU Usage tool charts and analyzes the amount of CPU being used by each module and function.
-
Memory Usage (XAML Only)
-
The Memory Usage tool monitors the live memory usage of your app.
-
Energy Consumption
-
The Energy Consumption tool models the power use of your app and describes the amount of power being consumed by the use of different resources.
-
XAML UI Responsiveness (XAML Only)
- The XAML UI Responsiveness tool measures the work being done by the UI thread of your app.

0 comments