Note: this post has been updated for Visual Studio 2015 RTM.
You are probably all familiar with the debugger DataTips that let you see the value of a variable when you hover over it in the editor. This post introduces the new PerfTips feature in Visual Studio 2015 for C#/VB, and C++ developers on all Windows platforms.
Why PerfTips?
We have been releasing new and improved performance tools in the Performance and Diagnostics hub in Visual Studio 2013 that help you diagnose performance issues in your app. However, for many of you, the majority of your time is dedicated to getting the app to function correctly (as opposed to focusing on the performance of your app). You would like to understand the performance of the code you write, but you might not have the time to learn and run the performance tools until performance becomes a big problem (which is sometimes too late). Furthermore, when you do want to investigate performance problems, you often just need a simple stopwatch measurement of how long it takes to execute isolated sections of code rather than the detailed top-down analysis provided by the hub tools.
We know that instead of running profiling tools, many developers do one of the following things:
- Insert code into their app (such as System.Diagnostics.Stopwatch) to measure how long it takes to run between various points in code, iteratively adding more stopwatches as needed to narrow down the hot path
- Step through code to see if any particular step “feels slow”
- Hit the Break All (“pause”) button at random points to get a feel of how far execution has progressed through their code, e.g. a loop. In some circles this is referred to as “poor man’s sampling”
- Over-optimize code without measuring performance at all, sometimes by applying a set of performance best practices (e.g. don’t use LINQ) across an entire code base
These practices are typically not very accurate, not a good use of time, or both. That’s why we introduced PerfTips: to help you to understand the performance of your app during normal debugging. Anyone that uses the debugger can use PerfTips to do a quick measurement on any section of code and find unexpected performance issues simply by setting breakpoints and/or by stepping through code with the debugger. With PerfTips you don’t need to run a separate set of tools or insert stopwatches into your code to take a simple performance measurement.
What are PerfTips?
As you step over lines of code or run from breakpoint to breakpoint, the debugger will display a PerfTip (tooltips **with **performance information) in the editor at the end of the code line indicating how long the program was running during the previous step or since the last breakpoint. All you need to do is look at it!
The ≤ sign indicates that there is some debug overhead included in the PerfTip and that this number is showing you an upper bound of how long the code took to run. The upper bound allows you to identify which sections of code are running fast enough, and which sections of code may need further investigation. Notice in the screenshot above, that the PerfTip is shown after the line of code that will be executed next. We decided that, while potentially confusing at first, this was the best place for PerfTips so that the location would be the same for both the single line and the multiple line cases (as shown in the next section).
If you hover over the PerfTip you will notice that it is a link:
When you click on the link it brings the Diagnostic Tools window into focus so that you can see the history of PerfTip values on the Events break track:
You can also correlate the elapsed time of various break events with the Memory Usage and CPU Usage graphs. The CPU Usage graph will help you to determine if the elapsed time includes non-CPU intensive activity such as I/O. Be sure to check out our dedicated Diagnostic Tools window blog post to learn more about using this window, but for the remainder of this post we are going to focus on using PerfTips in the editor.
Keep on reading to see how to use PerfTips in action!
PerfTips in Action
To show you an example of how it works, we will take a look at improving the startup performance of a C#/XAML Windows Store app. This app loads and displays pictures from the local pictures library and from the cloud, and we want to see how much time it takes to load images while the app is starting up.
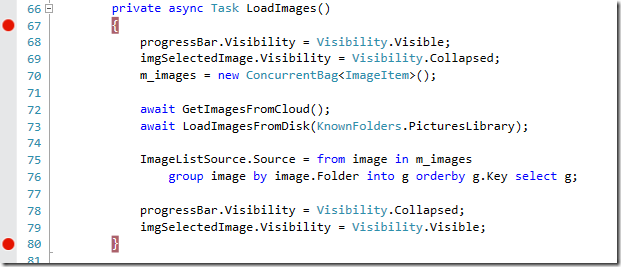
Instead of inserting stopwatch code into our app, we can measure how long loading images takes by setting breakpoints where we would have started and stopped the stopwatch. In this case, we have set breakpoints at the start and the end of the LoadImages method.
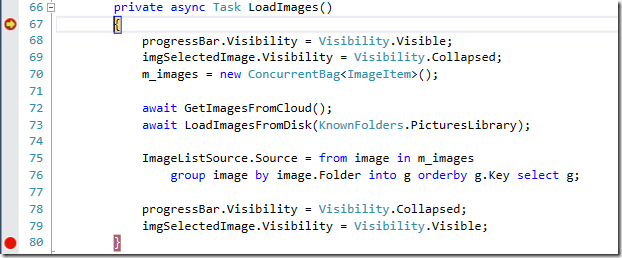
To take our first measurement with PerfTips we start debugging and wait for the first breakpoint to be hit (on line 67). Then we press F5 or click Continue to run to the second breakpoint and see the PerfTips for this section of code:

Here we are at the second breakpoint (on line 80), and the PerfTip is displayed:

From the information presented, we see that the app was running for about 2,780ms between these two breakpoints.
Side TIP: Instead of using breakpoints, we could have also taken a similar measurement by using Run To Cursor (Ctrl+F10, or right-click -> Run To Cursor) first with the cursor on the first line of the function and then again with the cursor on the last line of the function.
Now that we know how long this particular code path takes to run, we can run the same scenario again and after the first breakpoint is hit step over each line to see which lines are taking the most time. For those who are stepping over code to measure performance, you can now do the same thing and see more accurate measurements for each step. As we step over the first few lines we see that they take less than 20ms each, but when we step over GetImagesFromCloud (line 72) it takes about 1,391ms to run. Here we are before stepping:

… and then after stepping over GetImagesFromCloud (line 72):

Then we step over LoadImagesFromDisk (line 73) and see that it takes about 1,361ms to run:

Finally we step over the LINQ query (lines 75 and 76) and see that it takes about 259ms:

As we step over the remaining lines they each take less than 10ms to complete.
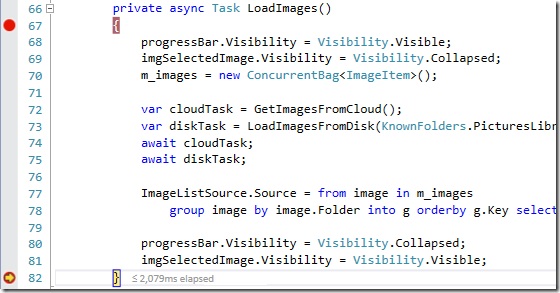
By stepping through the code we were able to determine that getting images from the cloud and loading images from the disk (statements on lines 72 and 73) both take about the same time and we can likely improve performance by doing both concurrently. Instead of waiting on both sequentially, we change the code to kick off both tasks at once and then await on both to complete. Running between the same two breakpoints as before, we measure how long it takes to load images with this change.

After the change this section of code completes in about 2,079ms which is about 700ms faster than the 2,780ms it took initially, a 25% improvement! This is an example of an optimization you could easily make while you are first writing and debugging this area of code.
If you are optimizing code without measuring at all, you can now take these kinds of quick measurements with PerfTips to make informed choices about where you spend your time. For example, before you may have considered improving the performance of the LINQ query by generating the collection of images manually, but now we know from the PerfTips that this line only takes around 250ms and we can expect to make image loading at most 10% faster by applying such an optimization.
Now that we’ve given you a tour of PerfTips, we’ll go over some best practices that you should keep in mind when using this feature.
Best Practice: Take Multiple Measurements
Performance naturally varies from run-to-run, and code paths typically execute slower the first time they are executed in a given run of the app due to one-time initialization work such as loading .dlls, JIT compiling methods, and initializing caches. Taking multiple measurements will give you an idea of the range and median of the metric being shown and will allow you to compare the first time vs. steady state performance of an area of code.
Best Practice: Verify in Release
If you want to make improvements on pieces of code that run for less than 50 milliseconds, or you are about to invest a lot of time in rewriting code to make it run faster, we recommend that you switch to the Release build of your app and use the tools that are available in the Performance and Diagnostics hub to measure the performance of your app without the debugger. Using the hub tools on a Release build without the debugger will more accurately measure the performance that the users of your app see, and provides a much more detailed breakdown of where time is being spent.
You can also change how you use the debugger in order to make PerfTips more accurate. When you are running with the debugger, there is some overhead included in the PerfTips when the debugger pauses and resumes the target process. While this overhead is normally small (a few milliseconds), the debugger may sometimes have to pause and resume the target process several times during a single step, making the overhead much larger. These pauses can also change the performance characteristics of code when it is executing. For example, cache performance on the CPU will be better when code is executing in a tight loop without breaking. To mitigate these effects you can measure larger sections of code by running between breakpoints as shown in the first example in this post.
In sections of code that are highly sensitive to compiler optimizations, the CPU time shown in debugging or when the debugger is attached can be significantly higher than what it is in release mode. This is because code optimizations such as inlining are not applied and extra validation such as array bounds checking are added in Debug builds. This allows you to have a better debugging experience, but with extra run-time overhead. You can mitigate this by switching to a Release build and debugging the optimized version of the code. If you are debugging managed code you will also need to uncheck “Suppress JIT optimization on module load” and “Enable Just My Code” in Tools -> Options -> Debugging. However, be warned that you will likely encounter breakpoints that fail to set and the yellow arrow moving unexpectedly when stepping. So, if you would like to verify the release performance of your app, as stated earlier, using the tools in the Performance and Diagnostics hub is the recommended approach.
We Want Your Feedback!
This is a new way of approaching performance analysis that is easy to use and is much closer to how you understand your code when you write it and debug it. We think you’re going to like PerfTips but we would like to make it as useful as we can to you. If you have feedback for us, you can immediately send us general comments in Send-a-smile, feature requests on UserVoice, and submit issues you run into on the Forums.


0 comments