
For those of you using .NET memory dump analysis to investigate memory issues and inspect values of objects and instances in your dumps, we have added a small improvement to bring you to your source in Visual Studio 2013 Update 3. If you have ever been examining your memory types and want to inspect the definition of a particular object or want to look at all the references of that object in your code, this feature will help you out.
Go to Definition and Find All References
You will need to have the corresponding source project opened with the .NET memory dump or .diagsesion file for this feature to be enabled. When you are in the Debug Managed Memory analysis window, the context menu will give you two additional options.

Go To Definition will take you to the definition of the selected type. This is the same as selecting an object in the editor and pressing F12.
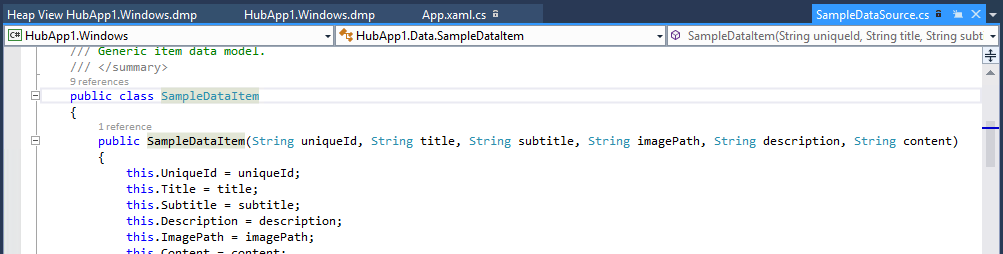
For finding all the places in code that touches your object, Find All References will search for all references to the selected type in your project. This brings up a results window displaying the results of the search. This is the same as the Find All References (Shift-F12).
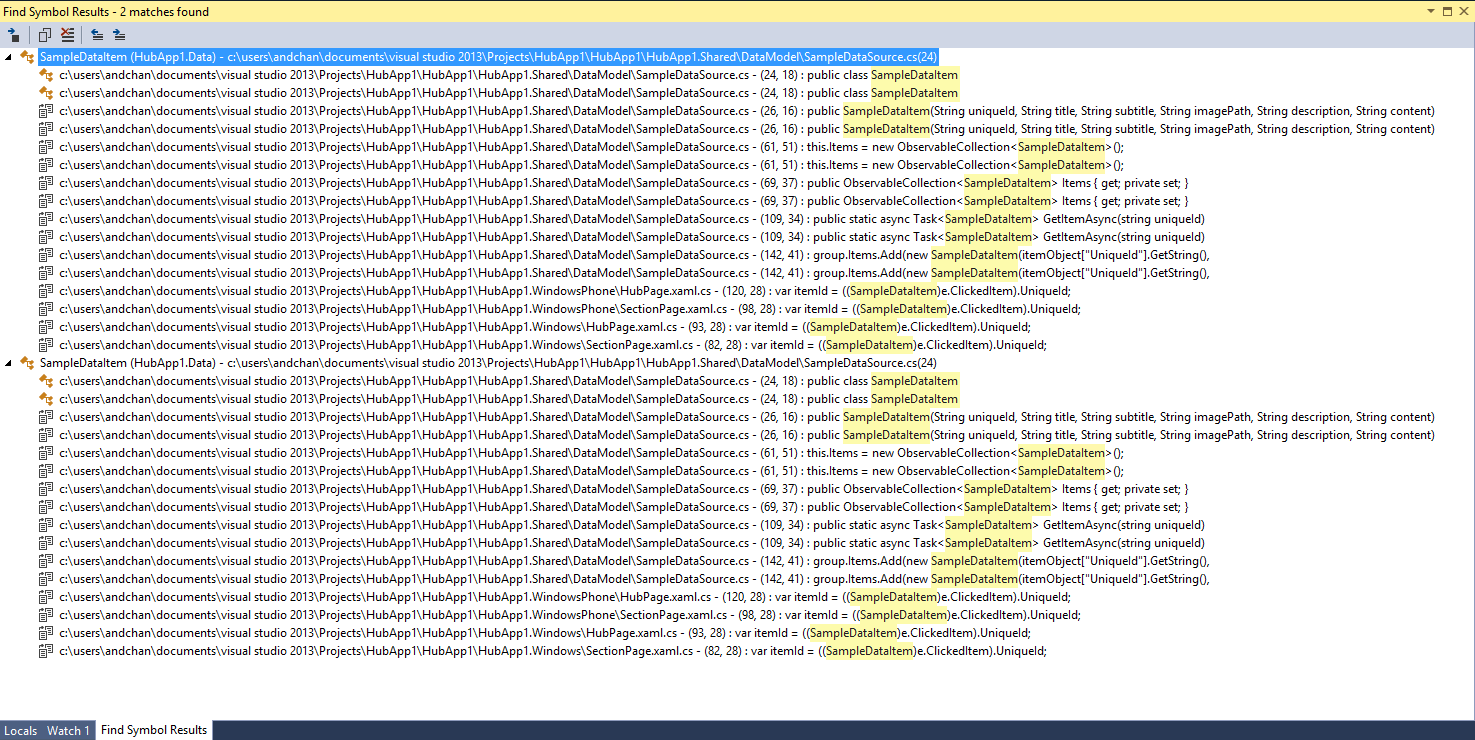
Selecting any of these lines will bring you to that spot in code.

In Closing
With this enhancement, we hope this streamlines your experience looking into .NET memory issues and digging into your code. If you’re interested in more information on how to use this tool, please refer to our previous walkthroughs that will get you started. If you have any questions or comments, please leave them in the comments below or in our MSDN forum.
0 comments