We’ve heard your feedback that you want the Visual Studio debugger to support child process debugging. Child process debugging means that when the application you are debugging creates another process, Visual Studio will detect this and automatically attach a debugger to the newly created process as well. To address this we’re releasing a power tool for Visual Studio that will enable you to do just this. Some important things to note:
- Download the tool from the Visual Studio Gallery
- The power tool requires at least Visual Studio 2013 Update 2 (will work with any higher update version and Visual Studio 2015)
- The tool works for both launching projects (F5), and for attaching to processes
- It requires a native debugger. This means if you are debugging .NET code, you must choose to enable mixed mode debugging (so managed and native)—this is done from the “Debug” tab on the project properties page (for most managed project types this is done by checking the “Enable native code debugging” checkbox under the “Enable debuggers” section of the page)
Once you install the power tool from the Visual Studio Gallery, a new menu item will appear on the “Debug” menu under the “Other Debug Targets” sub-menu.

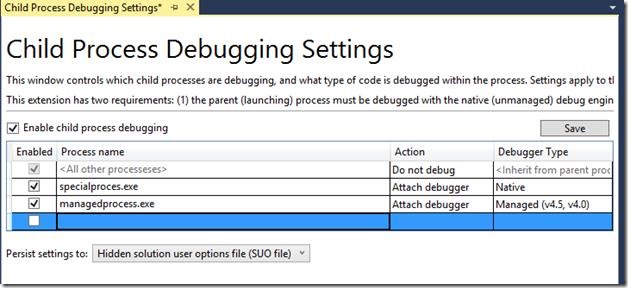
When you open the settings page, you’ll see a checkbox to enable child process debugging. To turn the feature on, check this and click “Save”. Child process debugging is now enabled for all child processes, and will by default use the same debug engine settings you are debugging the parent process with (e.g. native only, or mixed mode).

If you want to customize any settings this tool give you the ability to do that.
- You can change the “Debugger Type” column to a specific debug engine rather than inheriting the same settings that you are debugging the parent process with
- You can add additional rows to customize the behavior for a specific process. For example:
- If your process spawns multiple child processes but you only want to debug a single one (e.g. “specialprocess.exe”, you can add a row for that and then set the action for the “
” row to “Do not debug” - If you spawn some managed and some native process, you can configure child process debugging to use the specific debug engine (“Debugger Type”) for each process rather than mixed mode debugging them both
- If your process spawns multiple child processes but you only want to debug a single one (e.g. “specialprocess.exe”, you can add a row for that and then set the action for the “
- Once you have finished configuring your settings remember to click the “Save” button to persist them

Finally the “Persist settings to:” dropdown gives you the ability to save your settings. The default behavior will be to add it your solution’s .suo file (e.g. breakpoints are stored here). However you can optionally choose to export them to an XML file.
Please note that this is a power tool, so is not an officially supported part of Visual Studio. However I’d still love to hear your feedback in the comments section below, or through the Send a Smile feature in Visual Studio.

I see that debugging grandchildren from the parent is not support. Do you have plans to add it?
Send a Smile doesn’t exist anymore apparently.
Spent a day trying to get the web services to attach automatically. Unfortunately I couldn’t get w3wp.exe autodebugged using this approach either.