Debugging is part of every developer’s routine. Something that is not often talked about is how much time can be wasted trying to find the root cause of a bug. A debugging session typically starts with your best guess of where to put the first breakpoint. You go through the repro steps and hope that your breakpoint is hit before the bug manifests itself. You may have to do this a few times before you get it right, especially if you don’t know or remember the code very well. Then you step in and over method calls, hopefully carefully getting closer to the root cause, unless of course the bug is in a different code execution path. If that’s the case, it means you have to start over again guessing where to put a new breakpoint in a different place in the code. IntelliTrace helps you minimize wasted time by taking the guessing out of debugging and saving you numerous iterations of setting breakpoints and repeating testing steps. If you can’t wait to see IntelliTrace in action fixing a bug, take a look at these walkthroughs:
- Walkthrough of Live Debugging using IntelliTrace (Text Editor) – blog | video (demo starts at 4m5s)
- Walkthrough of Live Debugging using IntelliTrace (Social Club) – blog | video (demo starts at 1m30s)
- Finding swallowed and async exceptions using IntelliTrace – blog | video (demo starts at 43m55s)
IntelliTrace has been part of Visual Studio since 2010. Its set of features has grown over time (MVC Navigation, Jump to SQL, Sharepoint support, integration with MMA, integration with MTM, UI enhancements), but the main experience has remained unchanged … until now!
Before we get into what is new, let’s first remind ourselves of what Historical Debugging using IntelliTrace means.
Historical Debugging using IntelliTrace: Live Debugging and Non-Live Debugging
IntelliTrace offers two Historical Debugging scenarios to its users: Live Debugging and Non-Live Debugging.
Non-Live Debugging: Non-Live Debugging is when your application executes without Visual Studio attached to it, for example on a testing or production machine. The execution of the application is recorded using the IntelliTrace Standalone Collector to an .itrace file, which you can open in Visual Studio and get a debugging experience similar to Live Debugging (except you cannot execute forward, only navigate back to historical state). We will cover the Non-Live scenario in depth in a different blog post.
Live Debugging: Live Debugging is when you use Visual Studio to start your application by pressing F5 and Visual Studio automatically attaches the debugger to it or when you start the application outside of Visual Studio and you attach the debugger using Debug > Attach to Process…. If IntelliTrace is enabled it automatically records the execution of your application without you performing any additional steps. Any time the debugger breaks the execution of the application (e.g. because a breakpoint is hit), the IntelliTrace UI is updated and displays the data that has been collected up until that point.
You can configure what data IntelliTrace records using Tools > Options > IntelliTrace.
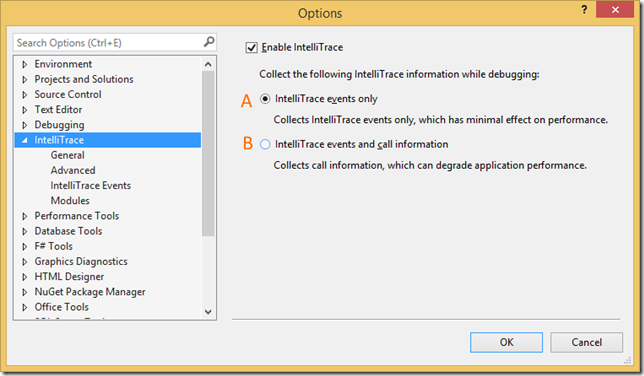
Your first decision is to pick between events that IntelliTrace considers interesting (option A) or events that IntelliTrace considers interesting and every method call plus parameters (option B). Option A is the default.
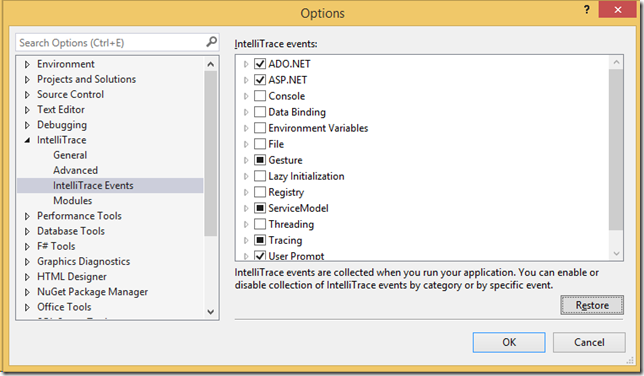
Your second decision is to pick which events IntelliTrace considers interesting you would like to collect. Your choice here will depend on the type of application you are debugging and the type of bug you are trying to fix.
For the rest of this blog post let’s focus on the Live Debugging and the default option A.
Live Debugging using IntelliTrace in Visual Studio 2015
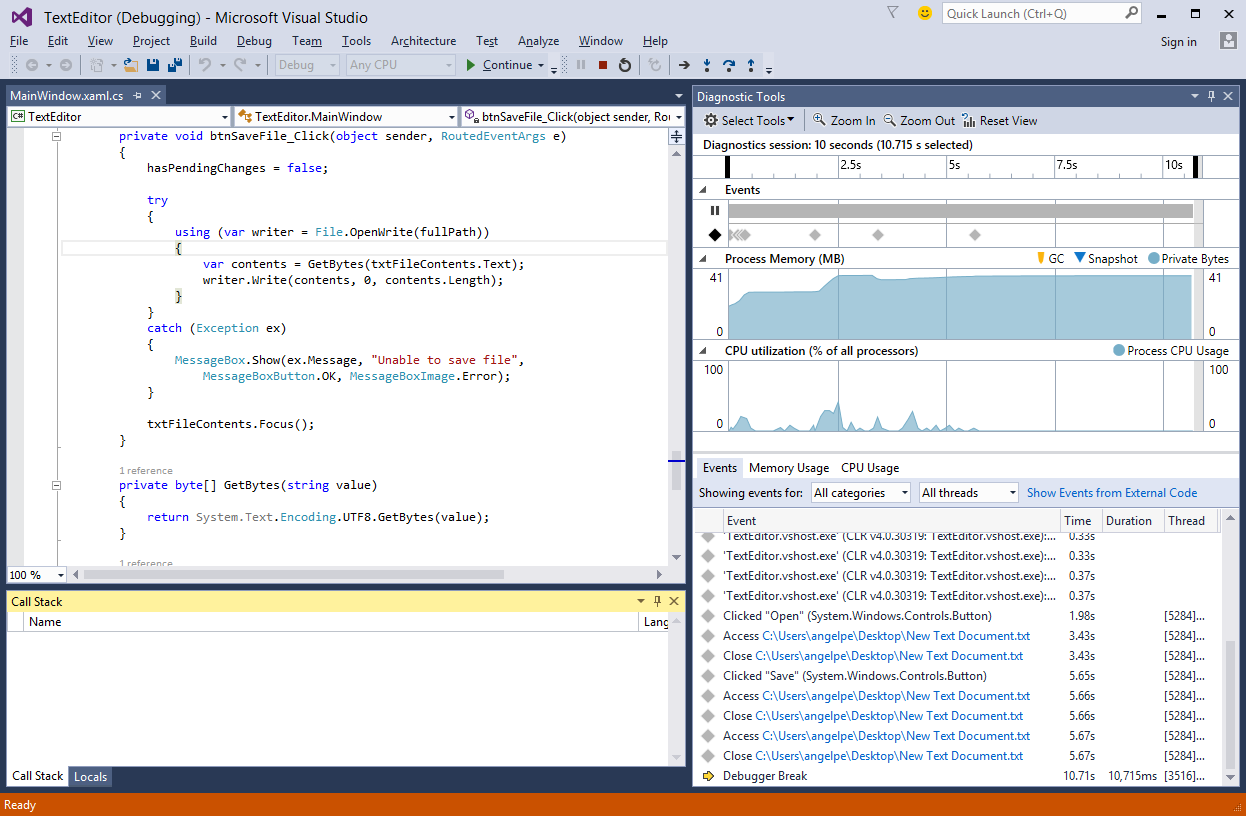
In Visual Studio 2015 IntelliTrace has been integrated into the new Diagnostic Tools window. The Diagnostic Tools window contains the CPU Usage tool and Memory Usage tool … along with IntelliTrace. If you open your project and start debugging it using F5, without you doing anything more, the Diagnostic Tools window will open and dock next to your code:
Let’s break down the IntelliTrace specific visual components of the Diagnostic Tools window component by component. Starting from the very bottom and moving towards the top we have:
- Events details: A tabular view of the data collected during the application’s execution
- Events timeline: A visual representation of the application’s execution on a timeline****
- **Diagnostic Tools toolbar: **Contains the buttons Select Tools, Zoom In, Zoom Out, Reset View
For information on the performance aspects of the window, be sure to check out our all-up blog post on the Diagnostic Tools window.****
Events details
This is a tabular view of the data that is collected during the application’s execution and it’s made out of the following columns:** **
- **Event: **The short description of the event that has been collected. The purpose of this column is to give you an idea of the type of event that has been collected just by skimming the list.
- Time: The number of seconds of application run time that had elapsed when the event was collected.
- Duration: The duration of the event, in milliseconds. This column only shows data for Break events.
- Thread: The name or ID of the thread that was responsible for generating the event. (Note: not all events are associated with a thread, e.g. module loads)
Possible actions:
- Single left click on a row to expand and Activate Historical Debugging: Selects the event both in the table and the timeline. In the table, the row is expanded to show more information about the event, if there is more information available. The expanded row contains an action link labeled “Activate Historical Debugging” which sets the debugger’s context to the moment in time the selected event was collected, showing historical data in the Call Stack, Locals and the other participating debugger windows.
- Ctrl + C: Copies the details of the selected event in the clipboard.
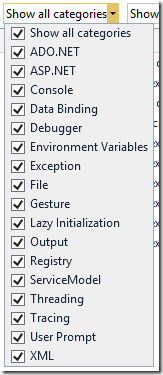
- **Filter events by category: **Shows or hides events of the specified categories
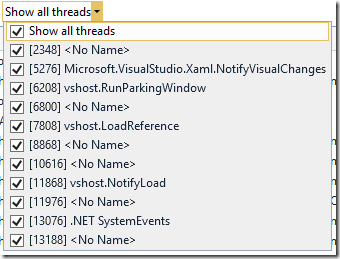
- **Filter events by thread: **Shows or hides events generated by the specified threads****
- **Show events from external code: **IntelliTrace respects the Just My Code setting and it will hide events that originate from non-user code. You can bypass the debugger setting and show events from external code (just like the Call Stack window):****
Events timeline
This is a visualization of the application’s execution on a timeline. The timeline is split into two tracks:
- Break Events track: This track shows events that stopped the execution of the application, such as breakpoints being hit, steps, the “Break All” pause button at the top being clicked, Debugger.Break() code statements and breaking exceptions.
- IntelliTrace Events track: This track shows all the other events collected by IntelliTrace that are not break events, such as SQL queries being execution, program output, ASP.NET web requests, file access, registry access, gestures, and so on. (full list of events that IntelliTrace collects)
The timeline displays exactly the same data as the tabular details view, the only difference being that events are represented as icons with colors:
- Break Events track: When you hover over a break event, it gets a “hat” with the following possible colors: Red = Breakpoint hit or Breaking exception, Yellow = Step, Blue = Break All or Debugger.Break() code statements.
- IntelliTrace Events track: Red = Exception, Purple = Custom event, Grey = Everything else
Possible actions:
- Click & drag to select time: You can select time by clicking and dragging on white space within the timeline. It filters the tabular details view to only show events that were collected within the selected time.
- Single left click on an IntelliTrace event: Selects the event both in the table and the timeline.
- Single left click on a Break Event: Selects the event both in the table and the timeline. The selected time is automatically updated to start at the beginning of the break event and to stop at the end of the break event.
Diagnostic Tools toolbar
![]() ****
****
- Select Tools drop-down: Adds/removes the CPU Usage and Memory Usage tools from the Diagnostic Tools window.
- Zoom In/Zoom Out buttons: Change the amount of time that is visible within the timeline.
- Reset View button: Resets the zoom level back to the default and makes the timeline scroll automatically as time goes by.
Give it a try and tell us what you think!
We are excited about the new experience for IntelliTrace in Visual Studio 2015 and the new visualizations it offers. You can try out the new IntelliTrace now by downloading Visual Studio 2015 RTM. If you are in need of some extra motivation for trying out the new IntelliTrace, take a look at these walkthroughs:
- Walkthrough of Live Debugging using IntelliTrace (Text Editor) – blog | video (demo starts at 4m5s)
- Walkthrough of Live Debugging using IntelliTrace (Social Club) – blog | video (demo starts at 1m30s)
- Finding swallowed and async exceptions using IntelliTrace – blog | video (demo starts at 43m55s)
Please give us your feedback so that we can improve. You can leave general comments & questions at the end of this blog post or via Send-a-Smile, and submit feature requests to our IntelliTrace UserVoice.



0 comments