The C# extension for Visual Studio Code offers powerful editing and debugging support for .NET Core applications on Windows, Mac, and Linux, including:
- Line by line code stepping
- Breakpoints (including conditional and function breakpoints)
- Variable inspection
- Multi-threaded debugging support
- Call Stacks
- Debug console window
Getting started
To get started you will need to do a few things (see our GitHub page for complete instructions)
Working with Console apps
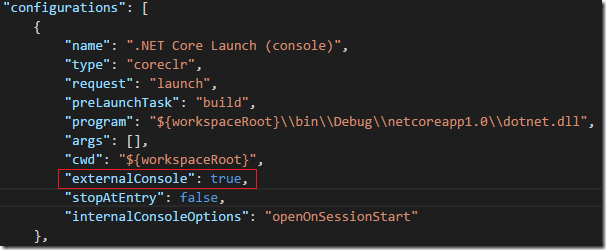
If you are working with a console application, by default the console output will appear in Visual Studio Code’s Debug Console window. In order to create a separate console/terminal window, change the “externalConsole” property in the generated “launch.json” file to true (launch.json is located in the .vscode folder placed in the root of your project).
Attach Debugging
The C# debugger supports attaching to processes. To do this, switch to the Debug tab, and open the configuration drop down and select “.NET Core Attach”. When you click the Start debugging button (or press F5) UI will appear to select the process.
Limitations
There are currently some features you might be used to in the Visual Studio IDE that we don’t have in Visual Studio Code yet. These include:
- Edit & Continue (the ability to modify code and have the changes applied while debugging)
- TracePoints
- Set Next Statement
What else can you configure?
Once you install and configure the extension you will have the basic debugging experience describe above, but there is much more you can configure using the launch.json file. For complete instructions see our GitHub page
Send us your feedback
As always we welcome your feedback. Tell us what you like and what you don’t like, tell us which features you are missing and which parts of the workflow work or don’t work for you. You can do this by submitting issues on our Github page or contacting us via Twitter.


0 comments