If you have spent time trying to make a compelling mobile version of your website you have likely hit issues with it not looking or working correctly on mobile browsers. To help with this on Windows Phone, we’re very excited to announce that in Visual Studio 2013 Update 2 we have enabled the use of Visual Studio’s debugging and performance tools for Internet Explorer on Windows Phone 8.1.
In this post, I’ll walk you through using these new capabilities.
- First we’ll create the sample ASP.NET project we’ll use in this post.
- Then we’ll show how ASP.NET can launch your project directly in the Windows Phone 8.1 emulator or on a Windows Phone device.
- Next we’ll walk through debugging websites where you do not have a Visual Studio project.
- Finally we’ll look at how to run the performance tools available in the Performance and Diagnostics hub.
Before I begin it is important to note that this walkthrough requires you to have installed Visual Studio 2013 Update 2 RC.
Creating the Sample
To illustrate how to use these tools I’ll start by creating an ASP.NET MVC application in Visual Studio 2013 Update 2.

If you want to follow along, create the ASP.NET project yourself and copy and paste the code below into the the specified project files
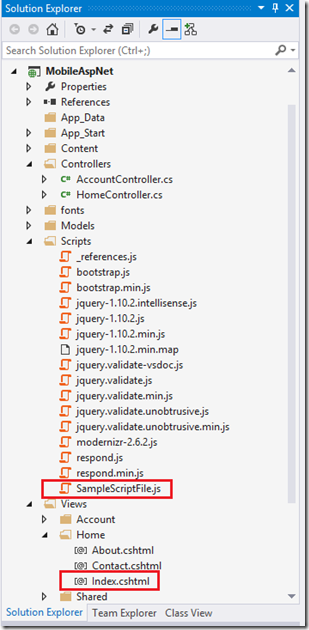
The great thing about the ASP.NET template is it automatically generates a mobile layout of the site for me. For the purposes of this post I’m going to make a page that animates a div when the user clicks a button to start the animation. First I add a script file to the project’s “Scripts” folder called “SampleScriptFile.js” with the following content:
var yCoord = 0;
function buttonClick() {
    var el = document.getElementById("msg");
    yCoord += 2;
    if (yCoord < window.innerHeight) {
        el.style.top = yCoord + "px";
        requestAnimationFrame(buttonClick);
    }
    else {
        el.innerText = "animation completed";
        el.style.top = "50px";
    }
}
I’ll then replace the content of the “ViewsHomeIndex.cshtml” file with
<style> <br /> div.message{ <br /> background-color:blue; <br /> color:white; <br /> position:absolute; <br /> } <br /></style> <br /> <br /><script src="~/Scripts/SampleScriptFile.js"></script> <br /> <br /><div id="message" class="message">Message</div> <br /><p><a onclick="buttonClick()" class="btn btn-primary btn-lg">Start animation!</a></p> <br />
Debugging ASP.NET applications
To make sure this looks like I want on the phone’s browser, I’ll change the launch location to be the Windows Phone Emulator. To do this, click the down arrow on the Start Debugging control, choose the new “Windows Phone” option, and select the first emulator “Emulator 8.1 WVGA 4 inch 512MB” option.
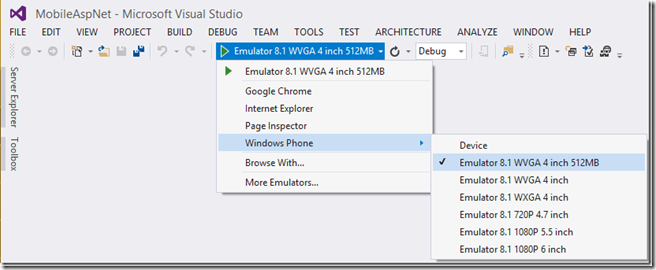
Next, I’ll start debugging (press F5), the emulator will start, and I will see the mobile version of my website running.

At this point I will note a few important things about the URL you may notice above, which by default uses “localhost”
- Here I am using IIS Express with the ASP.NET application. IIS Express will only accept connections from the same machine, so when debugging on the emulator “localhost” works as you would expect. IIS Express however cannot be used to debug on a physical device since it is a different physical machine
- To use the tools mentioned in this post on a physical device, you will either need to configure the project system to use IIS instead of IIS Express and set the start URL to be the computer’s name; or host your website on a separate server and use that URL (see the following section).
Debugging a layout error
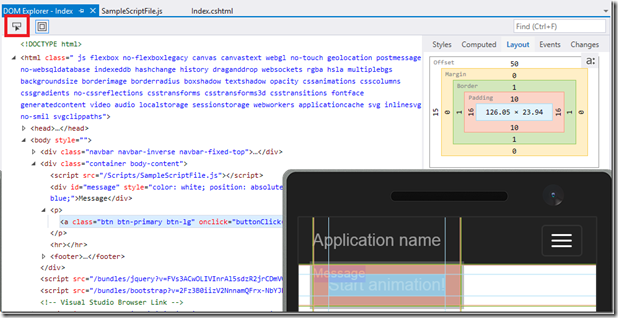
After I start debugging the first thing I see is that the “Message” div is appearing on top of the “Start animation!” button. On previous versions of Windows Phone I would have been left to trial and error to figure out what to set the top offset of the “message” div to. However now that I have the debugging tools I can leverage the DOM Explorer (Debug –> Windows-> DOM Explorer). In this case I used the “Select Element” feature in the top left, and clicked on the button in my application. Then looking at the “Layout” view, I determined the message’s initial top offset should be ~97px–to get this number I summed the vertical height and offset values of the button and all of the elements above it (50+1+10+23.96+10+1=95.96) and then added 1 and rounded 96.96 to 97.
Making this change to the style of the message div
div.message{ background-color:blue; color:white; position:absolute; top:97px; }
results in it appearing where I want it

Debugging a script error
Next I want to make sure that this functions as I expect. I click the “Start animation!” button and instantly the debugger breaks to tell me that an error occurred in my JavaScript.

Since I am using the standard script debugger, I can see in the DataTip that el is null.

After a bit of inspection, I realize that I mistyped the Id of the element (it should be “message” not “msg”). I’ll correct that quickly by changing the line to
var el = document.getElementById("message");
Then a quick test reveals that the message div now animates to the bottom of the screen when the button is clicked.
Even though I only showed the DOM Explorer, breaking on an unhandled exception, and DataTips in this brief demo, I want to point out the that full JavaScript debugging experience is available including but not limited to the following features:
- Breakpoints
- Stepping
- Watch and Locals windows
- JavaScript Console
- First Chance Exceptions
- Just My Code
- JSON Visualizer
And, because it is ASP.NET, I am also debugging the server-side code as well so I can set breakpoints in the C# code (e.g. in the Index() method of “ControllersHomeController”) which will be hit when called from the phone, the same as any other ASP.NET debugging session.

Debugging Without a Visual Studio Project
In the previous part of the post I covered how to debug ASP.NET applications on Windows Phone 8.1 with F5. However we recognize that not everyone is going to be doing ASP.NET development. So to debug web sites running anywhere and created with any backend technology we’ve added a menu option called “Debug Windows Phone Internet Explorer” (available under “Debug –> Other Debug Targets”)

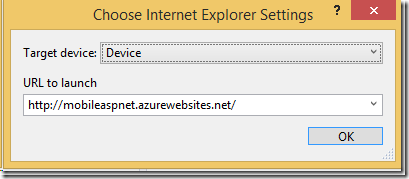
That will open a dialog that allows you to select the following options:
- Specify whether you want to debug in one of the emulators or a connected device
- Specify the URL you would like to debug.
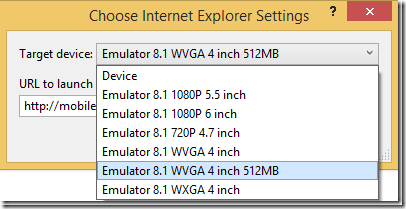
In this case I have published the ASP.NET application I created above as a Windows Azure website, I enter the URL for the Azure website version, then click start debugging.
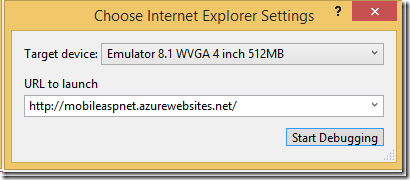
Since I don’t have a project, in order to set breakpoints in my source code, I can open any loaded script file from the “Script Documents” node in Solution Explorer.
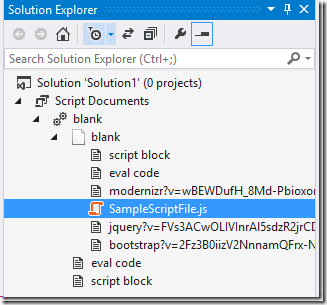
…and then the experience is similar as if I had a project open!
Debugging Performance
When running my application under the debugger I noticed that the animation wasn’t performing as smoothly as I would prefer. Before I jump to any conclusions, there are two important things to note about evaluating performance.
- Never evaluate performance when launching Internet Explorer using the debugging commands (“Start Debugging” and “Start Without Debugging”). When the debugging commands launch Internet Explorer, it is launched in a “debuggable state”, which causes JavaScript code to run slower than during normal browsing.
- You will want to test performance on a physical device before concluding it is acceptable. For some classes of performance issues (e.g. memory) the emulator will be sufficient. However for other types of issues (e.g. CPU consumption) the site will generally perform better on the emulator, and finally for drawing intensive operations the emulator will potentially perform worse because all rendering is done on the CPU where a physical device will have the ability render on the GPU.
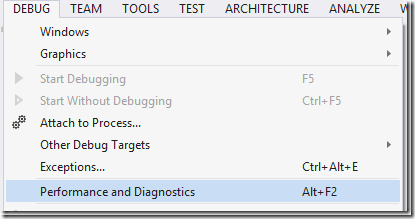
Since I’m not happy with the performance of the animation I’m going to use the performance tools available to me in the Performance and Diagnostics hub. To do this, open the Performance and Diagnostics hub (Debug –> Performance and Diagnostics)
From the “Choose Target” dropdown, select “Internet Explorer on Windows Phone”.
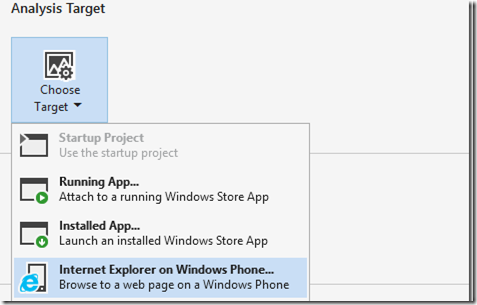
Enter the URL you wish to profile just as we did for debugging without a project.
I can now see the following performance tools available to me for Internet Explorer on the phone:
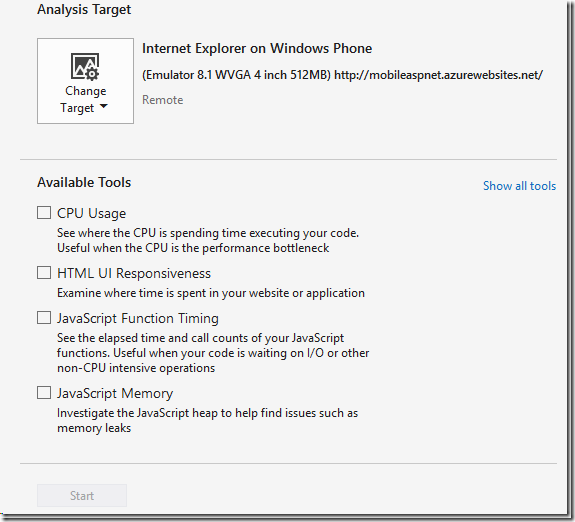
For the purposes of this example, I’ll select CPU Usage and HTML UI Responsiveness tools together, and then press “Start”. Internet Explorer on the phone will be launched and navigate to the URL I specified. I now see the CPU utilization graph updating live, and a message telling me that data is being collected.
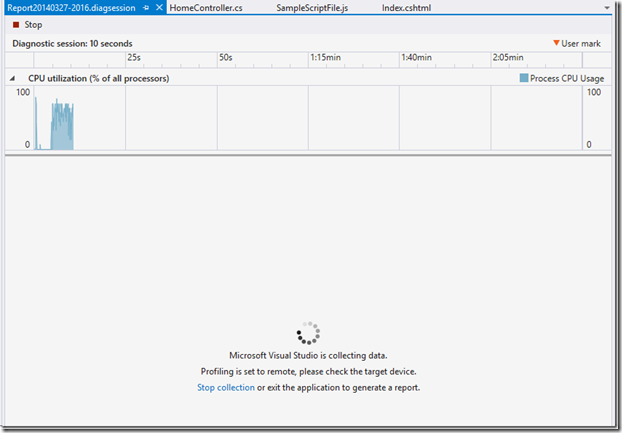
After clicking the button I can see that the jittery animation reproduces as I expect, so next I’ll click the “Stop collection” link on the collection page.
I’m now presented with the report showing me the CPU consumption and frame rate of the application where I can see that it does sometimes randomly drop from 60 fps to ~30 fps on the “Visual Throughput (FPS)” graph.
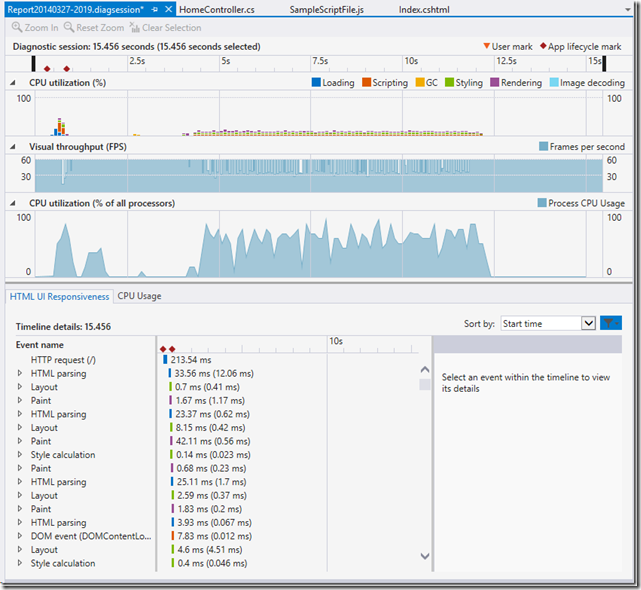
Since all of the available tools are well covered in the dedicated blog posts linked above I will not spend time digging into the reports here. However, after looking at the report above I see that every style update in script code causes a Paint and a Layout. After a bit of research I tweak the animation to use a CSS transform in conjunction with a CSS transition to animate the message box, which will do the calculations directly on the GPU. This gives me the following “SampleScriptFile.js”
function buttonClick() {
    var el = document.getElementById("message");
    el.style.transform = "translate(0px," + window.innerHeight + "px)";
    el.style.transitionDuration = "2s";
    el.style.transitionProperty = "transform";
    el.style.transitionTimingFunction = "linear";
    el.addEventListener("MSTransitionEnd", transitionEnd, false);
}

//This function sets the div back to its original position when the animation ends
function transitionEnd() {
    var el = document.getElementById("message");
    el.innerText = "animation completed";
    el.setAttribute("style", ""); //undo all the transition style properties
}
To validate this behaves as I expect it to, I run the profiling tools again, and can see that there are significantly fewer events occurring between starting the animation and it ending. (The single set of events corresponds to when I updated the div’s style to add the transition and transform properties.)

Note: The emulator does not have direct access to the development machine’s GPU, so it simulates the behavior on the CPU. If you are trying this on the emulator rather than the device you will not see the events appear in the HTML UI Responsiveness timeline, but you will see the CPU consumption of the site remain high in the CPU utilization graph. Also due to this, the physical device will likely perform better than the emulator in this case
In Closing
In this post we quickly walked through how to debug and profile web applications running in Internet Explorer on Windows Phone 8.1 devices. While we looked at simple examples, I hope that you can see how to apply these new capabilities to your web applications.
If you have any questions or comments please let us know by either commenting below or posting in our MSDN forum

0 comments