In this post we’ll explore how to use IntelliTrace in Visual Studio 2012 Ultimate Update 2 to debug custom Web Parts in a SharePoint 2013 and SharePoint 2010 application. First we’ll summarize SharePoint’s use of correlation IDs and the IntelliTrace enhancements in VS2012 Update 2, and then we’ll dive into a walkthrough.
SharePoint’s Unified Logging System and Correlation IDs
SharePoint has a built-in way of recording what happens during execution called the “Unified Logging System” or just “ULS” for short. ULS is always running and the log files it generates tend to be the first things that a seasoned SharePoint developer examines when trying to diagnose a problem with a SharePoint application.
When debugging web applications, it is often helpful to reason about a web request in isolation because it can be considered as a neatly contained unit of “action”. SharePoint generates a unique Correlation ID for each incoming web request and tags each ULS log entry with the Correlation ID of its associated web request, which facilitates this method of debugging. Filtering by Correlation ID in a tool like ULS Viewer allows you to focus on the isolated sequence of events in a single web request that exhibited the bug.IntelliTrace support for SharePoint in Update 2
For Update 2 of Visual Studio 2012, we have extended the capabilities of IntelliTrace to support SharePoint diagnostics. If you are not familiar with IntelliTrace’s existing support for ASP.NET websites, please watch this tutorial.
IntelliTrace now collects SharePoint ULS log entries as IntelliTrace events if the instrumented process is that of a SharePoint application. These ULS events, as well as all other IntelliTrace Events, have Correlation IDs included.
IntelliTrace associates events with specific web requests, but prior Update 2 this association was not visible anywhere other than on a Web Request Details page, which only shows events that are in that web request. For Update 2, we made this filtering scheme also usable in the IntelliTrace window when debugging SharePoint applications. The Correlation ID conveniently serves as the web request’s unique identifier in the filter string.
To enable these new features, all you have to do is use the latest standalone IntelliTrace collector on your SharePoint application and open the resulting log file in Visual Studio 2012 Ultimate with Update 2 installed.
Walkthrough
In the following walkthrough, we will debug a page in a SharePoint application that shows a cryptic error when we try to load it. We will collect an IntelliTrace log, open the log in Visual Studio, use the Correlation ID to find the faulty web request, and examine the log data to determine exactly where the bug is in the code.
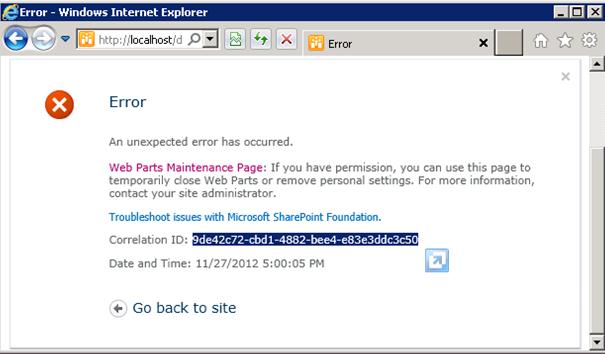
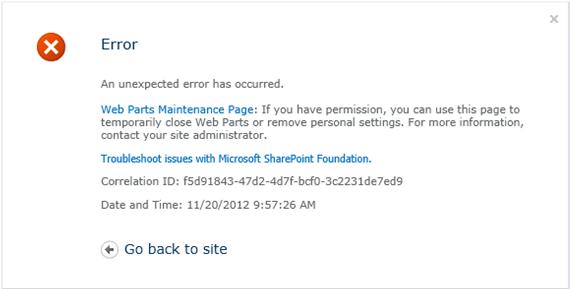
We’ve written a SharePoint application and one day our site just “stopped working”. That is, every time we try to access it, we get an error similar to the one shown below:
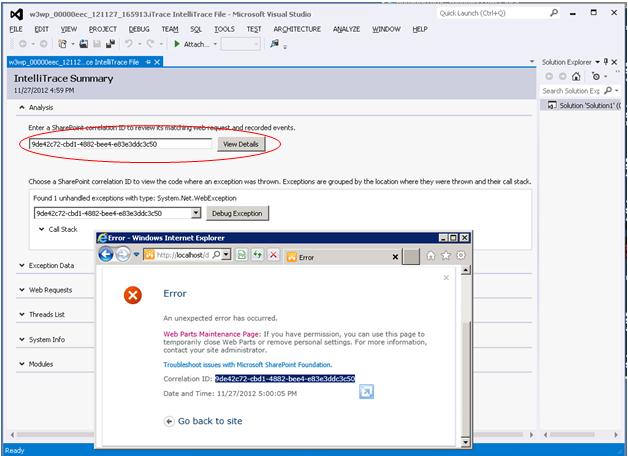
Unfortunately, these error messages don’t contain much information. Fortunately, they give us a Correlation ID with which we can dig deeper into the error. Let’s use IntelliTrace to fix this bug.
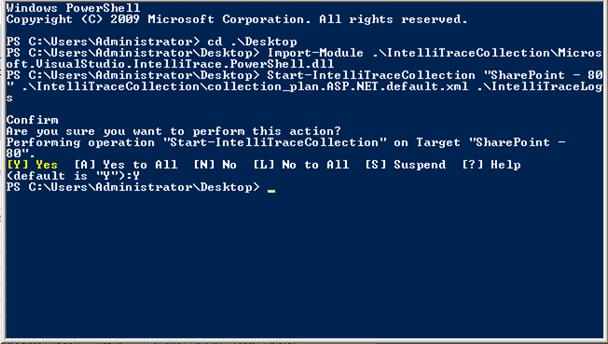
First, start collecting on the App Pool that contains the SharePoint application. In this example the App Pool is called “SharePoint – 80”, we used the default collection plan, and we told IntelliTrace to put collected logs into a folder called “IntelliTraceLogs” on the Desktop:
Then, navigate to the SharePoint site to get the error page. Note the Correlation ID:
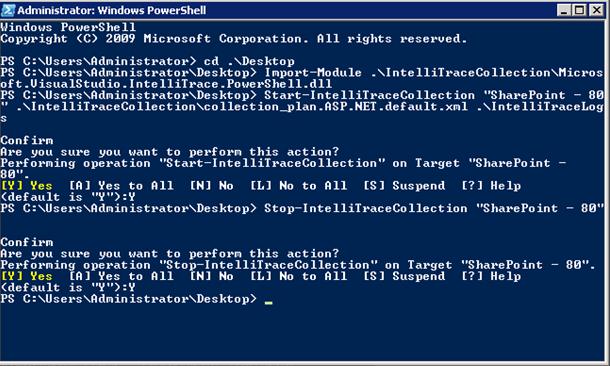
After the page finishes loading, stop collecting on the App Pool:
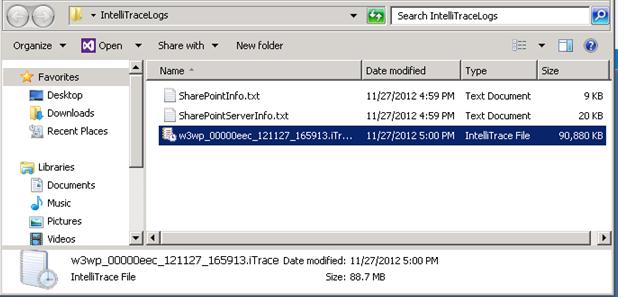
Now we navigate to the “IntelliTraceLogs” folder and open the IntelliTrace log:
Visual Studio will display the IntelliTrace summary page upon opening the log:
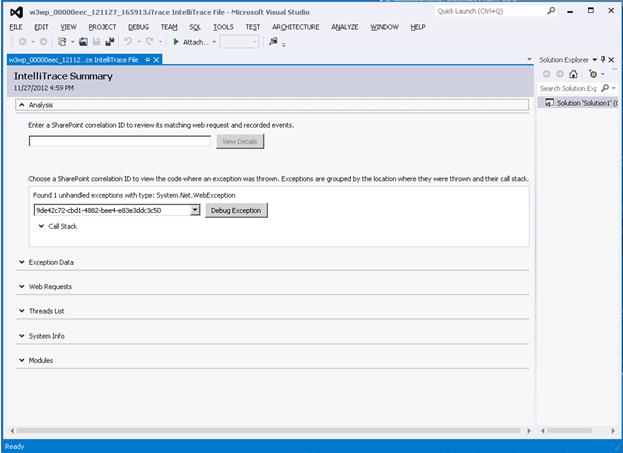
Since we already have the Correlation ID given by that error page, we can simply copy and paste it into the textbox and click “View Details”:
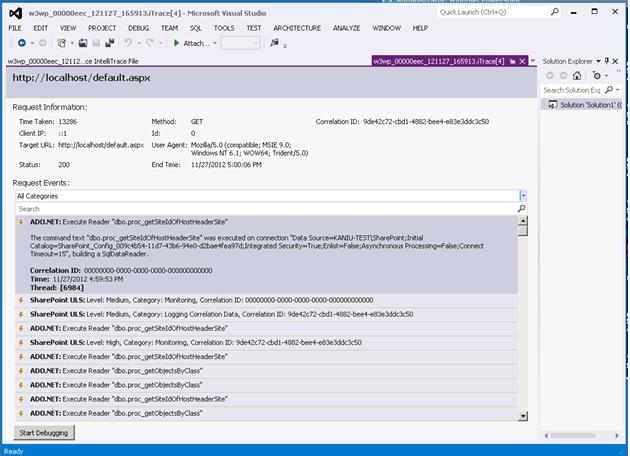
This brings up the Web Request Details page, which has information about the web request associated with the Correlation ID we entered. The list here contains only events that are part of that web request:
This list can be filtered in various ways. For example, we could use the dropdown to specify that we want to see only SharePoint ULS events, which is usually the most relevant category when debugging a SharePoint application. The error page said that the error was “unexpected”, so we should search for “unexpected” events to see the actual ULS event logged by SharePoint for that error:
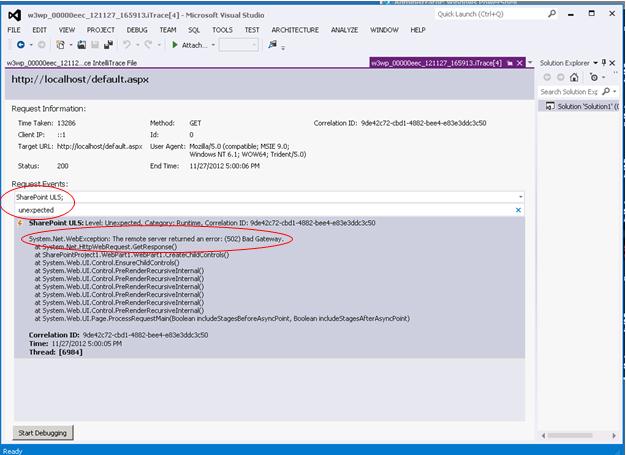
The unexpected event says that it was caused by a System.Net.WebException. This clue tells us that we should search for exceptions that have the type “WebException”:
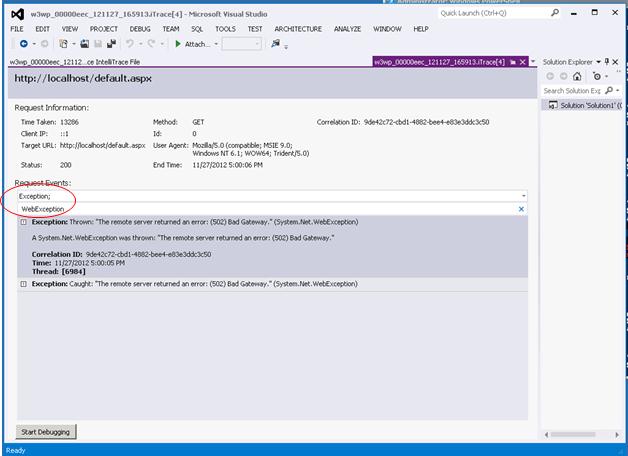
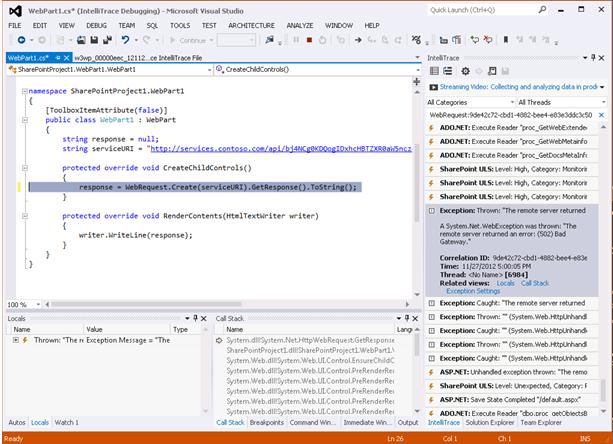
Looks like there was only one of these exceptions thrown during our reproduction of the bug. This must be the cause! We can double click the event or click “Start Debugging” to go directly to code:
Note that the IntelliTrace window has been filtered to show only events in the web request threw the unhandled exception. The string “WebRequest:9de42c72-cbd1-4882-bee4-e83e3ddc3c50” indicates that the list has been scoped to the web request that was assigned that specific Correlation ID (the same one in our error page) by SharePoint.
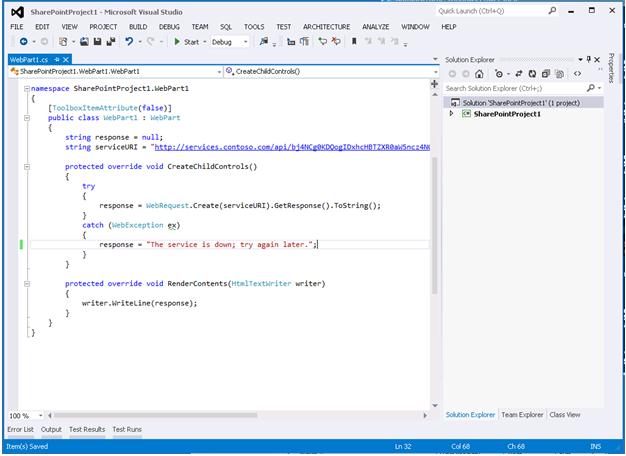
It seems that the service we were trying to use was down. Maybe it’ll come back later. The fix is easy: just catch the exception and display a notification message informing users about the situation:
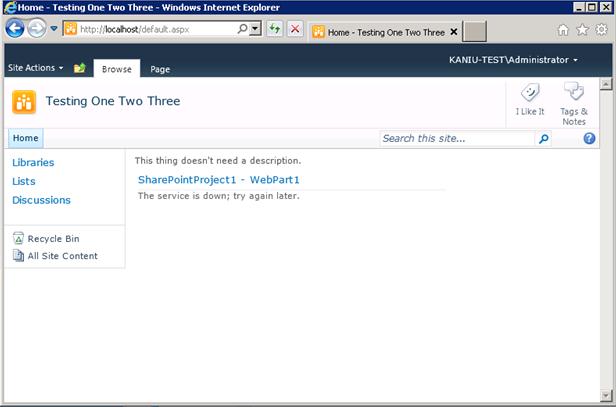
After re-deploying, our page now works just fine:
Conclusion
With IntelliTrace in Visual Studio Ultimate 2012 Update 2, SharePoint developers who are familiar with Correlation IDs now have a way of directly using them to debug their code. This is just one of the ways we’ve made Visual Studio more convenient for SharePoint development.
We greatly appreciate your questions and feedback, so please leave your comments below!

0 comments