In October, we released the new dashboards feature in VS Team Services and TFS 2015 Update 1. Dashboards are a customizable canvas that replaces your existing Team Overview page and enable you to visualize status and monitor progress across your project. We’ve heard a lot of great feedback that has shaped our direction and there is still so much we’d like to do. We’re glad that many of you have been enjoying the new features!
This isn’t a comprehensive list of the dashboards and widgets improvements we’re making, but it’ll give you an idea on where we’re going in H1. Many of the UX mocks I’m showing you aren’t final yet, so bear with us as we complete the designs.
Edit Mode
Last month, we released Edit Mode for dashboards which helps prevent inadvertent moving of widgets on your dashboards. It was also important to open up new scenarios for widgets – in particular, moving third-party widgets when we open up the widget ecosystem, and enabling drag-to-resize for widgets. We’ve heard feedback that many users want more control over the size of widgets (i.e. query results widget) and we’re working hard to get there.

**3rd Party SDK **
When we launched dashboards, we mentioned that our widgets are written as extensions, allowing you to write and share your own widgets. Widgets are implemented as a contribution point in the extension framework. We’ll be releasing a public preview of the widget SDK in Q1 of 2016. You’ll need some knowledge of JavaScript, HTML, CSS, and a good idea to build a widget. Stay tuned to our features timeline to hear more.
Auto-refresh
One feature we’ve heard requests for is the ability to auto-refresh dashboards for boards that are displayed on TV monitors or hallway screens. We’re planning to enable an opt-in feature to auto-refresh a specific dashboard every 5 minutes. We won’t be enabling this by default for all dashboards to be careful of unnecessarily load we put on the service.

Charts and widgets
More widgets and charts! This is by far the number one request we’ve heard around dashboards, and we hope you’ll help us build up the catalog once the SDK is released.
Charts in the catalog
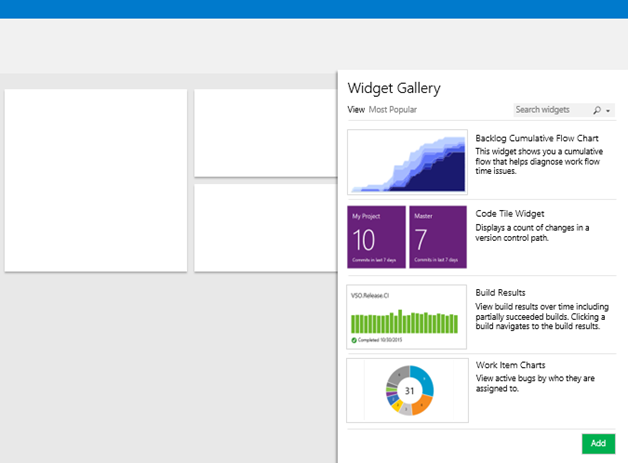
One area we’re focusing on is improving the discoverability and ease in bringing different charts on your dashboard. You’ll start to see the ability to add and configure a build chart, work item chart, or test chart directly from the dashboard.

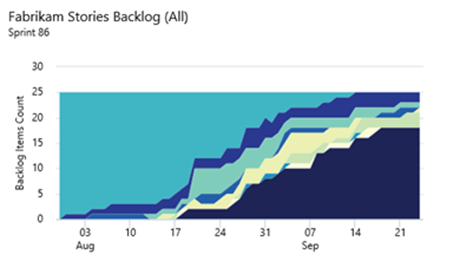
Cumulative flow diagram
Using a cumulative flow diagram can help visualize your work in progress to diagnose any bottlenecks happening in your software development process. We’ll be adding a cumulative flow widget to look at the flow of work in your backlog for a rolling period or a specific iteration.

Markdown widget from file
The first version of the markdown widget allowed custom markdown stored inside the widget. We’ll be making improvements to the existing widget to allow it to display any markdown file in your existing repository and to “add” a markdown widget directly from the code explorer.
There are so many other widgets in the works – test widgets, release management widgets, countdown widget – just to name a few. If there are specific widgets you’d like to see, feel free to use the smiley face in the top-right corner of VS Team Services or send us email at dashboard-feedback at microsoft.com.
New widget catalog
The last thing I want to share is some upcoming changes to the existing widget catalog. Today, when you add a new widget, the catalog opens up over the center of the dashboard. When adding a widget to your board, you need to add the widget to the bottom of the dashboard, then drag it to where you want it to go. The new catalog will allow you to add a place at the same time, and see your underlying dashboard.

Please reach out on Twitter (@karenkayliu) if you have thoughts, comments, or questions about anything described here. And please help us prioritize by heading over to UserVoice to add your idea or vote for an existing one or hit the smiley face in the top right corner of VS Team Services.
Thanks!
Karen Ng

0 comments