(Posting for one of the PMs on the Application Insights team Soubhagya Dash or just “Dash” as we call him in the hallways)
We are excited to announce the new Alerts page user experience! This experience replaces the prior page and has been rebuilt ground up with significant back-end service improvements as well.
- Immediately see details of the latest observation, to take you to the root cause faster.
- Holistic view with prior trends across all your active alerts – click/drag to zoom on any period.
- Details pane shows the selected observation right there on the same page.
Check it out! As always your feedback to help improve Application Insights is greatly appreciated.
Like to know more? Read on….
Page Improvements
1. Trend and current assessments at a glance.
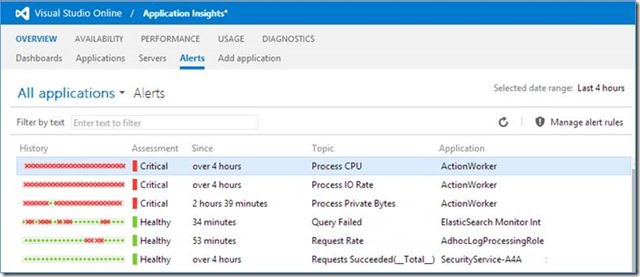
See instantly:
- If failure in one application is leading to failures in another.
- The severity of an on-going set of issues.
- How long a metric or test has exceeded the alert threshold. Find the earliest or latest alert quickly!
- The most urgent issues. Ongoing failures and the most recent recoveries are at the top, and the “Since” column tells you how long the recovery or failure has persisted.
2. Select up to 2 weeks date range to get perspective of recent history of all your applications. Widen the history column a bit to get more granularity. Use that view (like we do!) in your live site reviews. Spot an issue that is flip-flopping around the threshold.
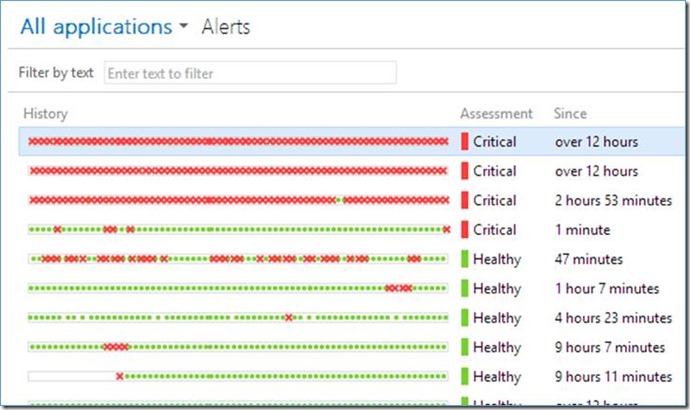
3. Quickly find information on the page by using the nifty filter: Enter any substring from the name of the application, performance metric or availability test name and the page will be filtered to matching results as you type.

4· Details Pane: Select any row on the left pane and see its latest evaluations on the right. The top-most alert is auto selected. If there are on-going issues when you get to this page, you have the details of the latest sample readily shown on the page without an additional click! We also have handy links to more details of the availability test or the specific performance metric, so you can get started investigating.
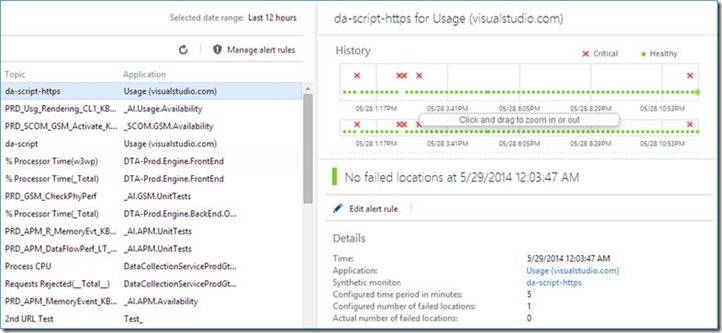
5· If you see that the sensitivity of an alert criterion needs to be adjusted, click the handy “Edit alert rule” link. With the context, and right within this page, you can adjust the alert rule so you get the alerts when truly warranted.
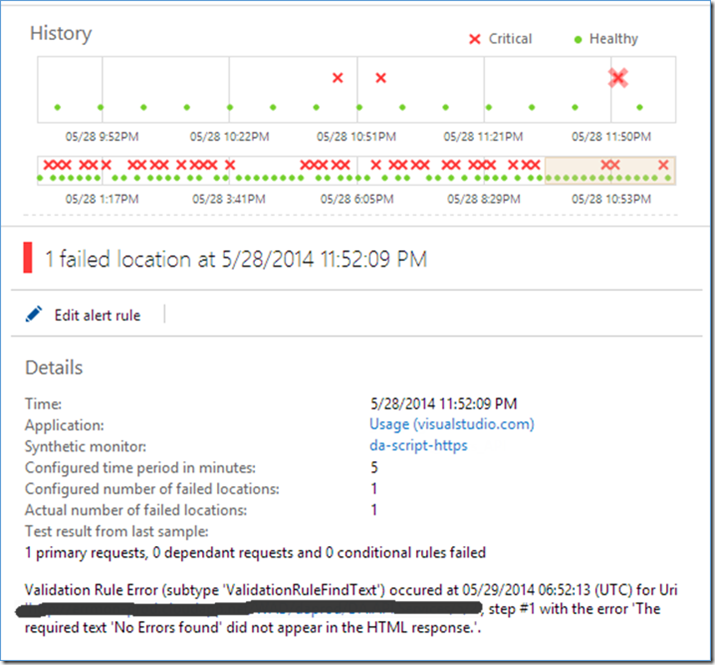
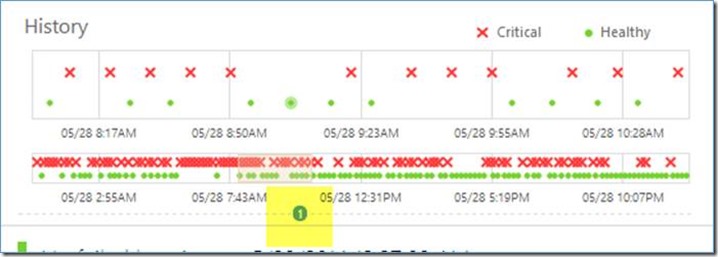
6· Click and drag on the timelines to quickly zoom in/out. Select any sample to get its details. It’s easy, for example, to find the last failure for an alert that has just recovered:
7· And last, but not the least: Deployments and configuration changes show up on the timeline. You can easily see whether a change improved performance or made it worse:

0 comments