Reporting has always been a cornerstone of TFS. By bringing together diverse data about your team’s software process, you are able to see relationships and gain insights on your process, and ultimately, take action to improve it. Since 2010, the on-premises TFS product has enabled different reporting options through Excel reports, SQL Server Reporting Services Reports, and SharePoint Dashboards. We then brought light-weight charts and the new dashboards feature inside both TFS and Visual Studio Team Services to bring to life a simple, yet powerful way to visualize your data. Our cloud reporting experience started with the Power BI Visual Studio Team Services Connector and we aren’t stopping there.
Today, I’m announcing that advanced reporting capabilities are coming soon to VS Team Services. You’ll be able to stay tuned through the “features under development” section on our features timeline. We think of the new reporting service as the beginning of an analytics service – our vision is to unlock analytics over your data and surface insights in an simple and meaningful way to drive action. The reporting experience will be available first in VS Team Services, and eventually replace the existing on-premises TFS data reporting warehouse.
Custom reporting capabilities
The public preview of the cloud reporting experience will enable custom reporting over your VS Team Services data. The service is backed by SQL Server and uses the Open Data Protocol v4. It is architected and built to be fast, performant, and scalable.
You’ll have the full power of OData available to you, including aggregation extensions. You’ll also be able to use data analytics tools like Excel, Power BI, Tableau, or even the Business Intelligence and Reporting Tools (BIRT) in Eclipse to mashup data from multiple sources and create powerful visualizations of your data. And since it’s OData, there are a number of other ways to access data – programmatically with .NET or Java, or via direct URL queries in the browser. It’ll also be possible to build a VS Team Services dashboard widget or extension using the data service.
Let me give you an example. Let’s say I wanted to get the sum of all remaining work in my account. With the on-prem TFS reporting options, that would not be an easy number to get. With the new reporting service, I can construct a direct URL and use aggregation extensions to easily return that value using the query below:
<a href="https://[collection">https://[collection</a> name].analytics.visualstudio.com/DefaultCollection/_odata/WorkItems?$apply=aggregate(RemainingWork with sum as SumOfRemainingWork)
To grab all work items and then group them by type, I can use the groupby clause and the following query:
<a href="https://[collection">https://[collection</a> name].analytics.visualstudio.com/DefaultCollection/_odata/WorkItems?$apply=groupby((WorkItemType), aggregate(Count with sum as Count))
Now let’s take the result of that query and bring it in to Power BI. Using the treemap visualization you now have a view of all the work items we have in mseng, the VS Team Services account that we use to build VS Team Services and TFS.

Work Item Data
The first type of data available will be work item data, followed by version control, test, build, and release data.
There will be a number of new capabilities that you can report on that weren’t available previously, such as:
- Velocity with both estimated and actual values
- Capacity across teams and projects
- Filter data by teams (i.e. Give me all the work items for Team X)
- Kanban data and metrics (i.e. median days in state, lead time, and cycle time)
- Trend and rollup data
- Tags
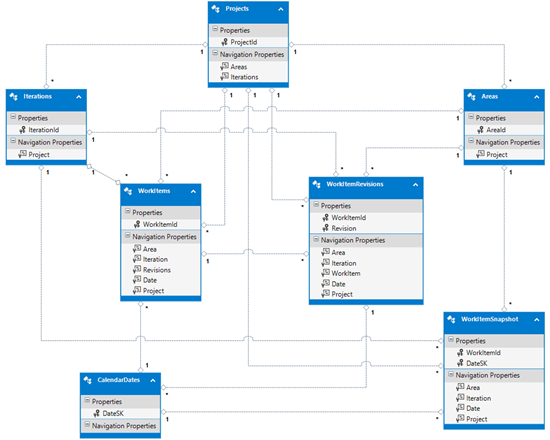
The schema below shows you the richness in the current data model we have for work items. Keep in mind that this isn’t comprehensive, but an early look at what’s there.

We expect to have a public preview of our cloud reporting experience for work item data for your Visual Studio Team Services accounts in Q3 of 2016.
Thanks!
Karen Ng, reach me on twitter @karenkayliu

0 comments