Nothing is more frustrating than trying to debug an application that runs significantly slower when you’re debugging it than it does when it runs without a debugger attached. Over the years we’ve received numerous complaints along the lines of “when I run my application without the debugger it takes a few seconds to execute a scenario, but with the debugger it can take several minutes.” By far the most common cause is a large number of exceptions being thrown and caught somewhere in the application (we’ll look at why later in the post).
You can usually work around this issue by reducing the number of exceptions being thrown, but unfortunately if the exceptions are fully contained in a 3rd party library there is nothing you can do other than suffer through a slow debugging experience. So we’re pleased to announce that in Visual Studio 2015 in conjunction with .NET 4.6 (available in [Visual Studio 2015 CTP 6][1]) we significantly reduced the performance overhead when handled exceptions occur outside of your code (meaning they are thrown and handled in a module excluded by the debugger’s “Just My Code” (JMC) setting). In this post we’ll briefly look at how much this can improve performance, then we’ll talk about what you can expect to see based on this change.
Example of performance speedup for handled exceptions
First, let’s look at what this means in practical terms. I created an application that will throw and catch the number of exceptions I instruct it to before completing the method call. First, let’s look at how long it takes for the debugger to run the method when 100 exceptions are thrown and handled (also referred to as “first chance exceptions”)

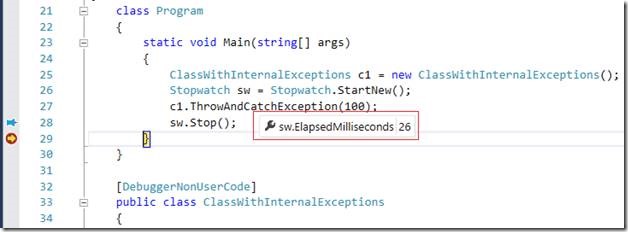
Note: I’m using a *StopWatch to record the time and have displayed it by *pinning the DataTip to the editor**
Notice that it took ~813ms seconds to execute a method that did nothing other than throw and catch 100 exceptions with the debugger attached. Next, to simulate this code running in an external library, I’ll tell the debugger this isn’t user code by adding a DebuggerNonUserCode attribute to the ClassWithInternalExceptions definition. Running it again yields a time of ~26ms meaning it ran ~97% faster!

Marking the code as non-user on VS versions prior to VS2015 (or with a .NET Framework prior to 4.6) will not provide any savings and you still have to suffer though the slow performance.
A peek under the hood
To understand the reasons behind the performance gains, it’s important to understand how exceptions work when a debugger is attached to a .NET process. When an exception is thrown (even if it will be handled) the runtime pauses the process to send a notification to the debugger so it has the opportunity to stop on the throw if you have enabled this in your exception settings; if not, the debugger resumes the process. As you can see, it doesn’t take many exception events to significantly impact the performance of your application when debugging. There are a few factors that contribute to the exact performance overhead including the number of threads in the process and the depth of the call stack where the exception occurs, but in both cases more will mean higher overhead. However, regardless of your exception settings, when Just My Code is enabled the debugger will never break for an exception that is thrown and handled in non-user code. Meaning you were paying a performance penalty that would yield little benefit, so we fixed it!
Feel free to download the attached project and experiment with the performance impact of exceptions in various scenarios including stack depth and the number of threads in the process.
Notable points
There are a few things to note about how this change works.
- It only applies when Just My Code is enabled (the default setting) and you are debugging a .NET application running on the 4.6 (or newer) runtime. Since 4.6 installs with Visual Studio 2015, this is only a potential issue if you are remote debugging on a machine without Visual Studio 2015 installed or are debugging an application that is running on the .NET 2/3/3.5 runtime.
-
It will not change the performance overhead for exceptions that are thrown in your code
-
As demonstrated above you can potentially work around this issue if you absolutely can’t avoid a large number of exceptions in your code by marking offending code as non-user code for sessions where you don’t need to debug into that code.
-
With this change, you will not be able to see exceptions that were thrown and handled outside of user code in the IntelliTrace events view.
Conclusion
You saw that a high volume of thrown exceptions can severely impact the performance of your debugging session, so to address this we significantly reduced the impact when they occur in non-user code. If you have any questions or comments, please let me know below, through Visual Studio’s Send a Smile feature, or in our MSDN forum.
[1]: http://blogs.msdn.com/controlpanel/blogs/posteditor.aspx/Visual Studio 2015 CTP 6 “http://www.visualstudio.com/downloads/visual-studio-2015-ctp-vs”

0 comments