In this blog post I am going to walk you through fixing a bug using IntelliTrace in Visual Studio 2015. If you haven’t done so already, check out the announcement of IntelliTrace in Visual Studio 2015 which gives you an overview of IntelliTrace and its UI. You can see this walkthrough as a video here (demo start at 4m5s).
The application I am going to be working with is a simple text editor built using WPF (I have included the source code in case you want to follow along):
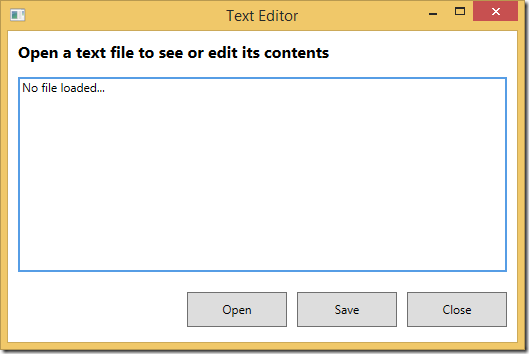
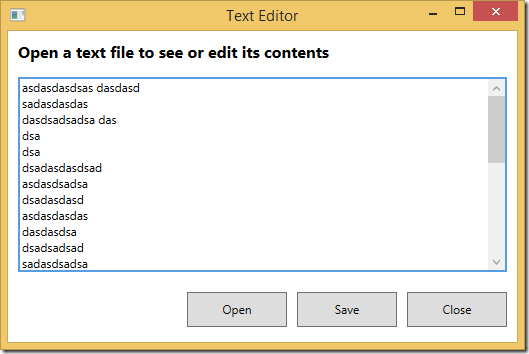
The bug I want to fix has to do with saving the file after it has been edited, so let’s open a file first:
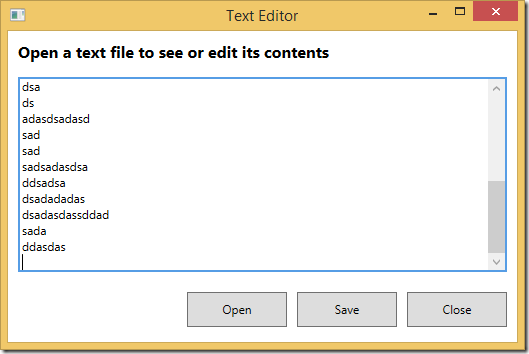
The contents of the file are not important. The bug I want to fix is that if I make any changes and I click on the “Save” button, the scrollbar will move to the top and so will my cursor:
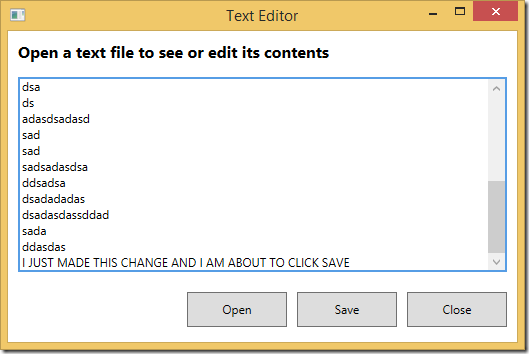
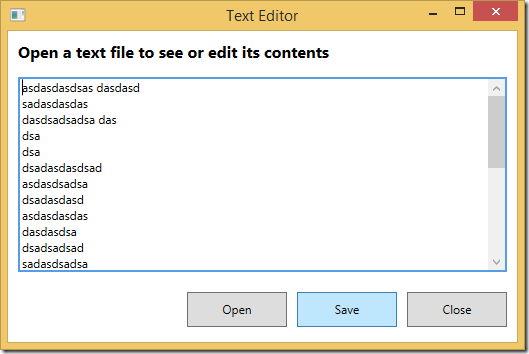
Let’s start by trying to fix this bug using just the debugger with IntelliTrace turned off. Where would you start? What would be your next move if you were asked to find the root cause of this issue? When I ask this question, most people shout out “the event handler”, meaning that they would start by putting a breakpoint at the first line of code in the event handler of the “Save” button.
So let’s go ahead and set that breakpoint, scroll the editor to the bottom and make another change:
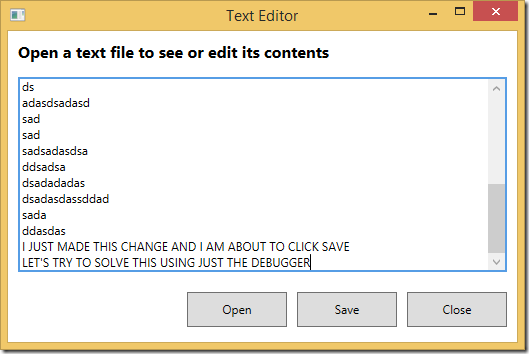
I click the “Save” button and the debugger breaks at my breakpoint:
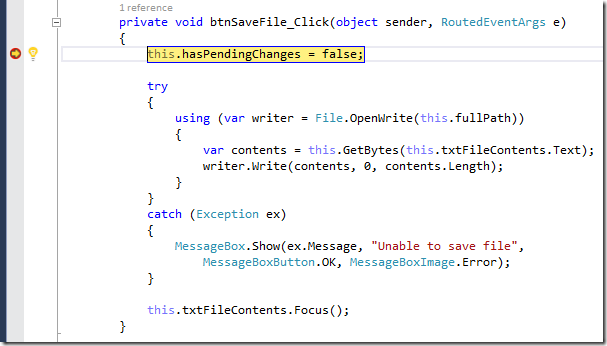
None of the event handler’s code has executed yet. Before I step through this code I want to make sure there is nothing obvious that stands out. From experience, many will point out that this.txtFileContents.Focus() looks suspicious, so I’m going to comment that part out (using Edit & Continue) and continue stepping:
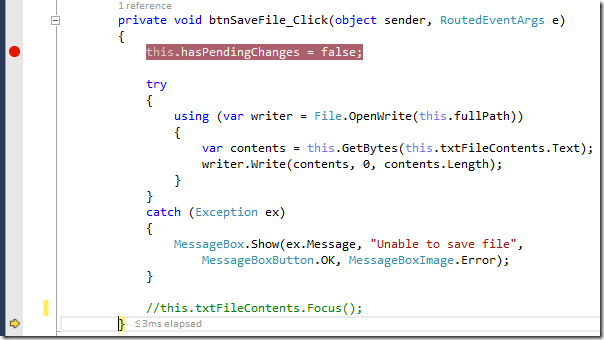
There were no exceptions thrown and nothing else looks suspicious, so I’m going to press F5 to continue running the app and see if the bug is fixed:
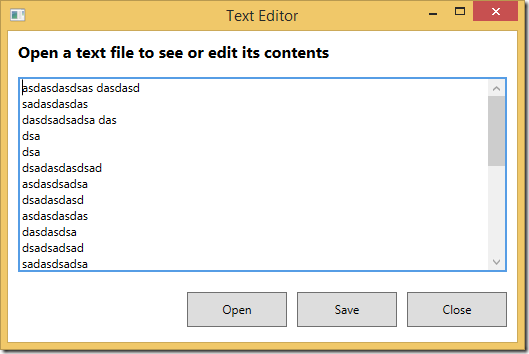
Nope, the editor still scrolls to the top and the bug is still there. Unfortunately I was wrong about the method call I commented out and nothing else stands out. There were also no exceptions thrown, so I no longer think the root cause of this bug is in the event handler of the Save button.
What next? Where would you look now? When I ask this question, I usually have to wait a little bit, but eventually people start offering clever suggestions such as:
- Do a search for “txtFileContents” and see if there is any code related to it that looks suspicious
- Figure out what the class scope variable “this.hasPendingChanges” does
The theme to recognize here is that we are not exactly sure what to do next. We looked at the obvious place but we didn’t find anything, and now we are just guessing. Next we need to read the code and understand it a bit better before putting another breakpoint somewhere and reproduce the bug again.
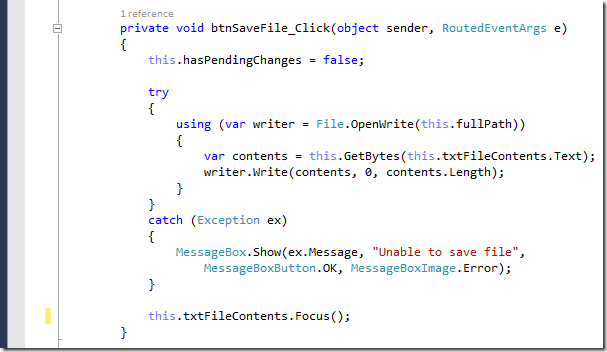
Instead, let’s see how IntelliTrace can help. I start by stopping the current debugging session, undoing my changes to the code and removing the breakpoint:
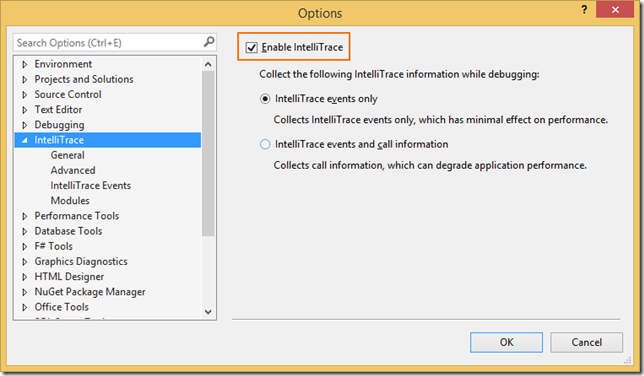
Then I make sure IntelliTrace is enabled by going to Tools > Options > IntelliTrace (it is enabled by default):
Before I press F5 again, I make sure the events I am interested in are being collected by IntelliTrace. I turn on the File and Gesture events because the bug occurs during saving a file after clicking on a button:
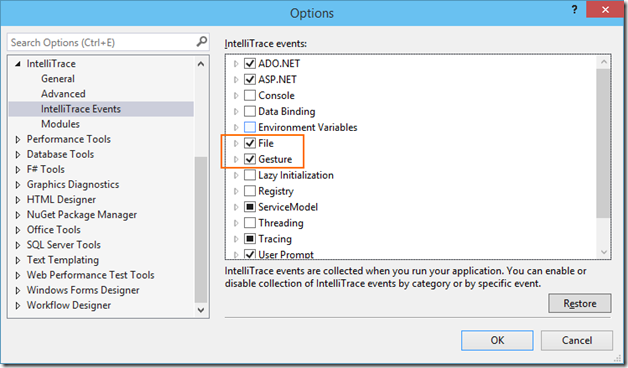
I don’t mind some of the defaults being “on”, such as ADO.NET and ASP.NET, because if the events don’t happen they are not collected. I now press F5 again and make another change:
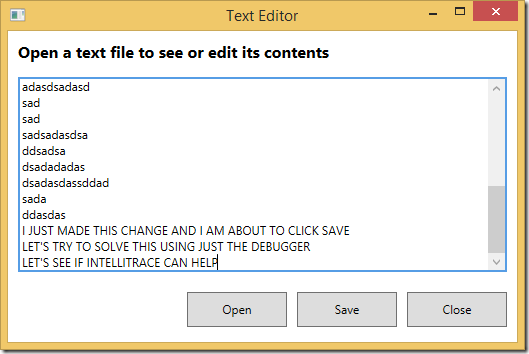
I click “Save” again:
… and now that I have reproduced the issue I want to see what IntelliTrace has collected. The data only becomes visible when the debugger breaks execution, so I will go ahead and hit the “Break All” button which will Break execution on All threads and allow me to inspect the application’s state with the debugger:

As soon as I do that, the Diagnostic Tools window (which has automatically opened and docked next to our code) is updated with all of the data collected by IntelliTrace:
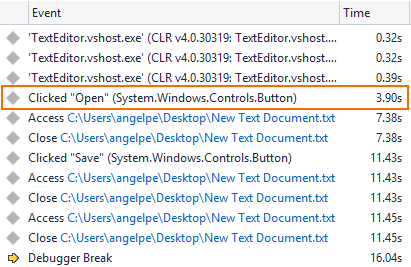
I go through the list of events to find something I am familiar with so I can orient myself and I find the event that was me clicking the “Open” button to open the text file:
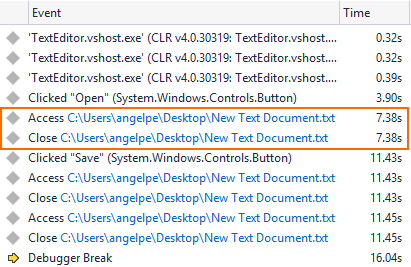
Following it I see a File Access and File Close event, which makes sense because we are opening the file to read it and once we are done we close it again:
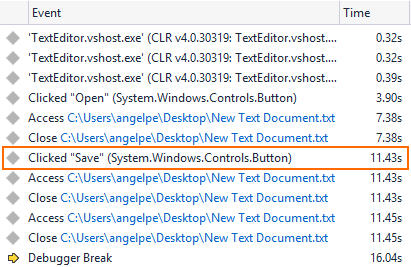
So far so good. Next I see the event from clicking the “Save” button, which I did after making my changes:
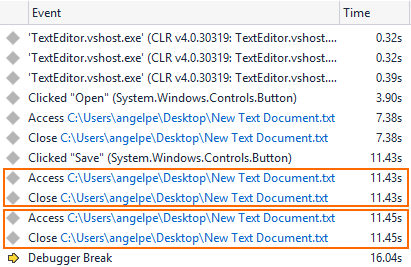
This is where it gets interesting. Following this event I see something that I did not quite expect, I see two sets of File Access and File Close events:
What IntelliTrace is telling us is that the file gets accessed twice after it is saved. This is strange and unexpected and likely to be the cause of our bug, but even if not we should investigate this unexpected behavior anyway. So without doing anything more than simply looking at the data collected by IntelliTrace, I already have a better idea of where the bug might be. What I want next is for IntelliTrace to tell me how the two sets of events are different and why they happened.
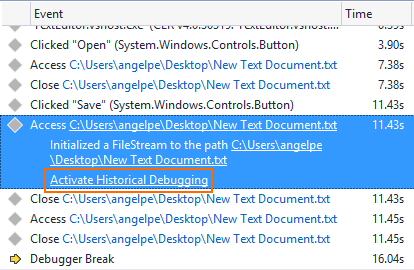
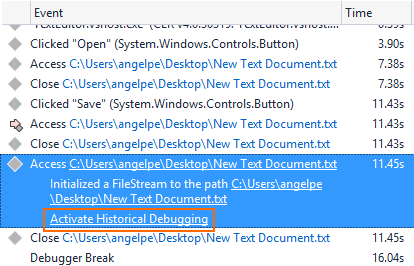
To do this, I first select the File Access event (by clicking on it) and then I click on “Activate Historical Debugging”:
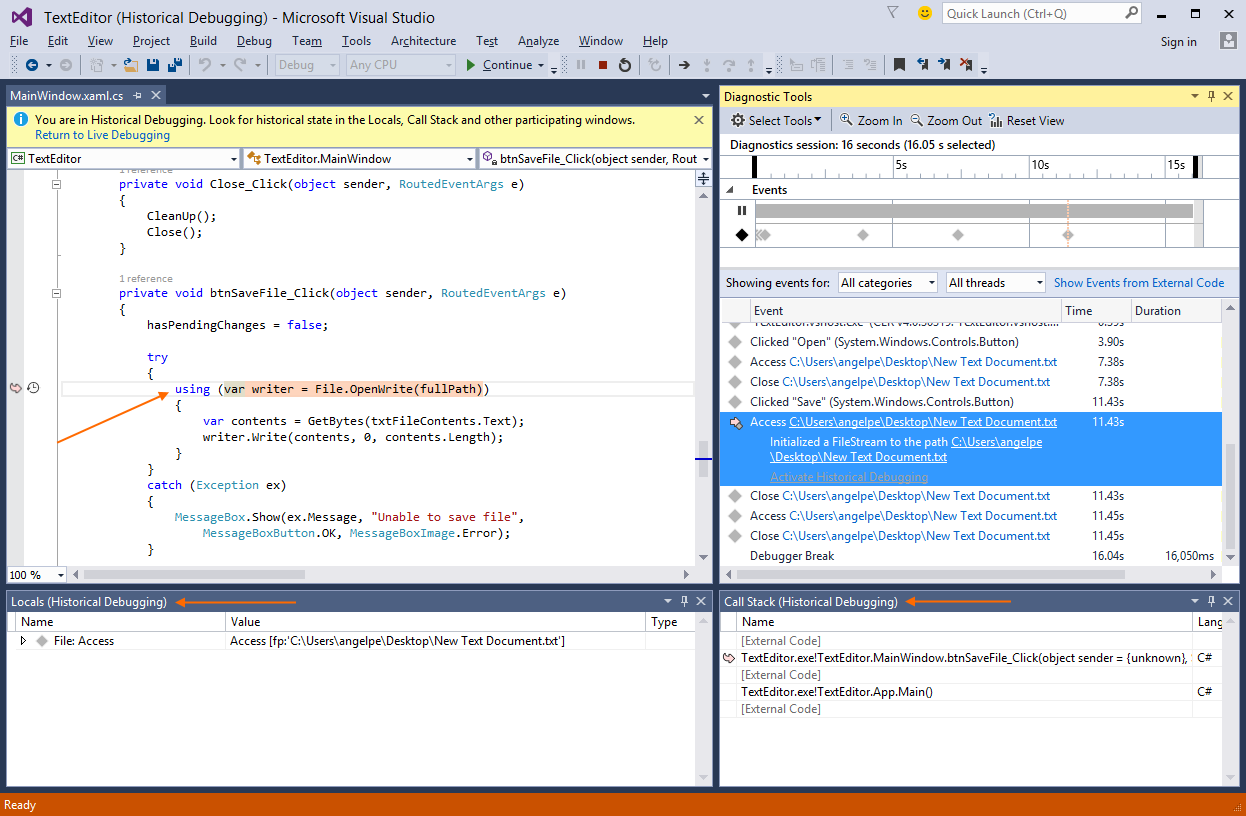
As a result, the code editor shows me the line of code responsible for generating this event and the debugger’s time context is set back-in-time to the moment when the event was generated:
By looking at the editor I can tell that the event I activated Historical Debugging for is coming from the event handler of the “Save” button, which is what I expected. Similarly, the subsequent File Close event is the end of the using statement which closes the file (I haven’t shown this here). Next I will look at the second File Access event after the “Save” button is clicked by activating Historical Debugging for that one:
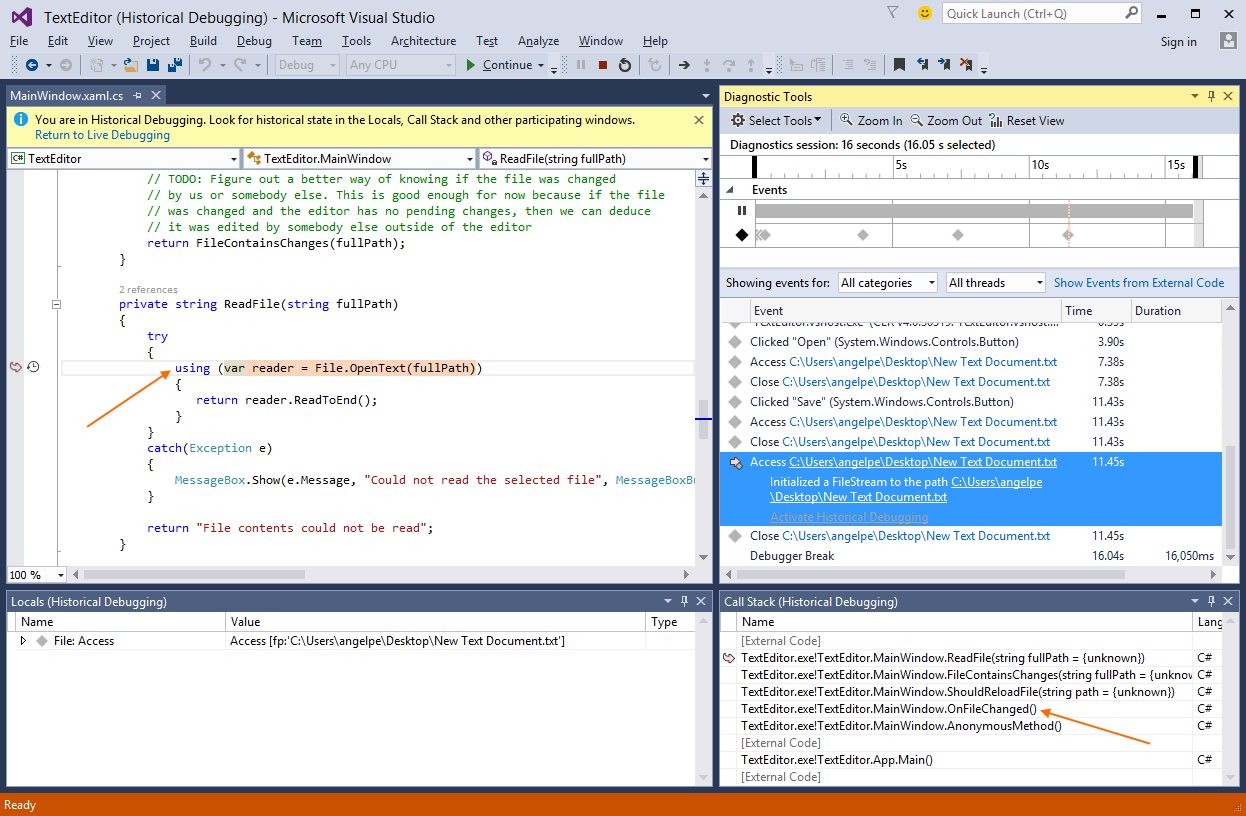
This time what I see is not what I expected:
Apparently the second File Access event is coming from the ReadFile method, a method I never expected to get called when saving. I don’t understand why this code is getting executed, so I will use the historical Call Stack to find out:

Looking at the Call Stack, I can tell that the ReadFile method is called when a change is detected in the file, judging by the name of the method “OnFileChanged”. I don’t really know why or when this gets called, so I double click on the frame with “AnonymousMethod()” in the Call Stack to take a look at the calling code:

It looks like the application monitors the opened file for any changes made by other users and warns you to not overwrite their changes. Here is what this feature looks like in action:
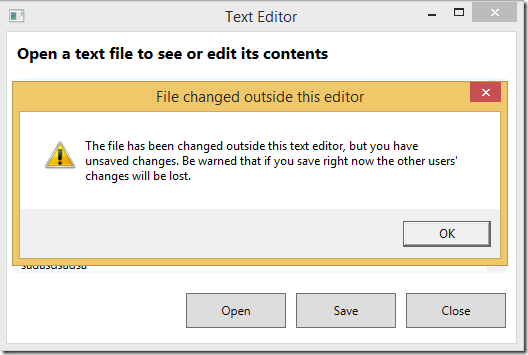
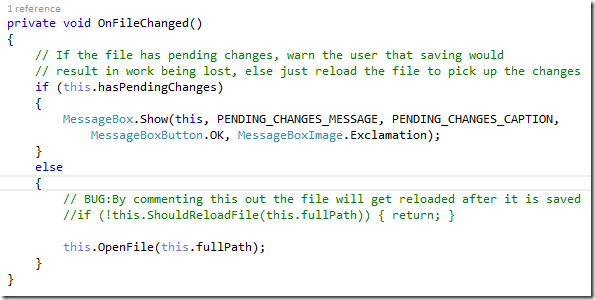
Part of this feature is if there are no changes to the file and someone else edits it, the file is reloaded automatically so I have the most up to date copy. However, there is a bug in the “OnFileChanged()” method. It is supposed to ignore changes coming from myself, but instead the file is getting automatically reloaded in error:
Wrapping up
By walking through this bug fix we have been reminded that even bugs that appear simple on the surface can have their root cause hiding in unexpected places. IntelliTrace saved us valuable time during debugging by allowing us to “travel in the past” and examine the state of the application at interesting moments, avoiding wasteful iterations of setting breakpoints and repeating testing steps.
We are always looking for feedback and comments for our features. You can leave general comments & questions at the end of this blog post or via Send-a-Smile, and submit feature requests to our IntelliTrace UserVoice. You can also send us a tweet or visit the MSDN Diagnostics forums.

0 comments