As product development adapts to the demands of continuous delivery models and agile methodologies, the developer is being entrusted with bringing in product changes with a higher quality bar. Besides strengthening processes to include quality checkpoints like gated check-ins, rolling builds and other regression checks, the developer can provide a higher degree of confidence in their code by ensuring that all product code changes are accompanied by a strong suite of unit tests. Test Driven Development (TDD) is one excellent step towards this. Since unit tests are owned and maintained by the developers, they can ensure that these tests are healthy and at a 100% pass rate prior to any code being committed to source control. This helps to maintain the basic sanity of product code.
Code coverage has been a very useful metric in detecting the efficacy of your unit tests. Using code coverage numbers you can decide if your product code is being adequately exercised via your tests or if you need to work on adding some more of them into your solution. In fact some teams like to set a high code coverage percentage as a target and maintain this throughout the development lifecycle.
Keeping these current development practices in mind the code coverage tool has been seamlessly integrated into the Unit Testing experience, making it easier to use for the developer. This has been achieved by moving from a static, post-compile instrumentation model to a dynamic, runtime instrumentation model. Those details deserve a blog post of their own though.
Today let me take you through the list of “visible” changes that we trust will make your experience with code coverage a whole lot simpler.
1. No .testsettings overheads for code coverage
VS 2012 introduces a new and simplified code coverage experience. Now we instrument native and managed binaries (DLLs/EXEs) as they are loaded at runtime as long as these binaries are a part of your solution, and get called by any of your test cases under execution. In contrast, you had to specify your target dlls in your .testsettings file in VS 2010.
For advanced users we allow customization of our selection logic using the .runsettings file. For mode details see our blog post “Customizing Code Coverage in Visual Studio 11”
2. Support in Visual Studio’s Test Explorer window
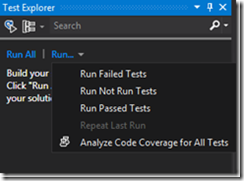
With this prominent menu item in your Test Explorer window you can now run your tests and get code coverage data all at once, by just clicking the “Analyze Code Coverage for All Tests” instead of the “Run All” item. With minimal execution time overhead this will run all your tests and display the code coverage results immediately after the run is completed.

You get a similar menu item for code coverage when you select and run a subset of your unit tests from the Test Explorer window.
3. Native is a first class citizen
Yay! With the introduction of the Native Unit Test project in VS 2012 we have enabled code coverage for native code as well. Now you no longer need to move to the command line when you want coverage data for native applications. The experience remains exactly the same whether you are working with managed code or native code. What’s more – mixed solutions work just as well.
4. The .coverage file is leaner and meaner
You want to share your .coverage file? Go ahead and share the file – and only the .coverage file. In VS 2012 the .coverage file is self-contained and we have tried to ensure that we keep the size to the very bare minimum even with this additional data. So no more copying of instrumented binaries with the .coverage file for it to open up in Visual Studio.
5. Support in the new test executor command line
The new unit test executor vstest.console.exe supports code coverage with a simple addition of the “/enablecodecoverage” switch. Append this switch to the command line arguments used for your test run and you get code coverage data as well.
6. Support in Team Build
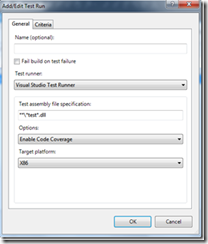
Enabling code coverage on your build definition is as simple as selecting the “Enable Code Coverage” item in the options combo box when you specify your test dll to be run. And yes, this works on your Team Foundation Service too.

Note: This is available only when you select the “Visual Studio Test Runner”
7. Support for .net/cpp custom unit test adapters
As you all know the unit testing framework is now extensible and supports custom test adapters. The xunit, nunit folks have their adapters available via the Visual Studio Extensions gallery already and code coverage is functional on these test adapters. We would work for any custom adapter that deals with .net (managed) or cpp (native) code. Caveat: If the adapter is doing any runtime magic e.g. using the .net profiler interfaces for some reason, code coverage would not be supported.
Note: Other languages are not supported for code coverage
While making all the above changes we have ensured that your interaction with the .coverage file is exactly the same as VS 2010 – through the Code Coverage Results window. We continue to report block and line coverage data.
We surely hope that the above changes have helped alleviate the pains of getting started and working with code coverage in this Agile world.
Resources:
a) MSDN: Using Code Coverage to Determine How Much Code is being Tested
b) Troubleshooting missing data in Code Coverage Results
d) MSDN Forums
Code Coverage is available in Visual Studio 2012 RC Premium and Ultimate editions.

0 comments