Asynchronous code is ubiquitous in Windows apps. While asynchronous code can be great for creating responsive apps, it can also make it difficult for developers to understand the flow of their application. In Visual Studio 2013 and Windows 8.1, we have added new features that make it easier to understand the state of your asynchronous app so that you can more easily find and fix your bugs. These features work across all of the languages that Visual Studio supports for Windows app development (C++, JavaScript, C#/VB).
In this first post I will describe the enhancements to the Call Stack window. I’ll show examples for each language starting with C++, then JavaScript, and then C#/VB. In a follow-up post, I will describe asynchronous debugging improvements made in the Tasks window.
Developers typically rely on the Call Stack window to tell them how their application got to their current location, but this was not the case for asynchronous calls. The new call stack window for asynchronous debugging provides additional stack frames to aid in understanding how the program reached a location inside an asynchronous call.
C++
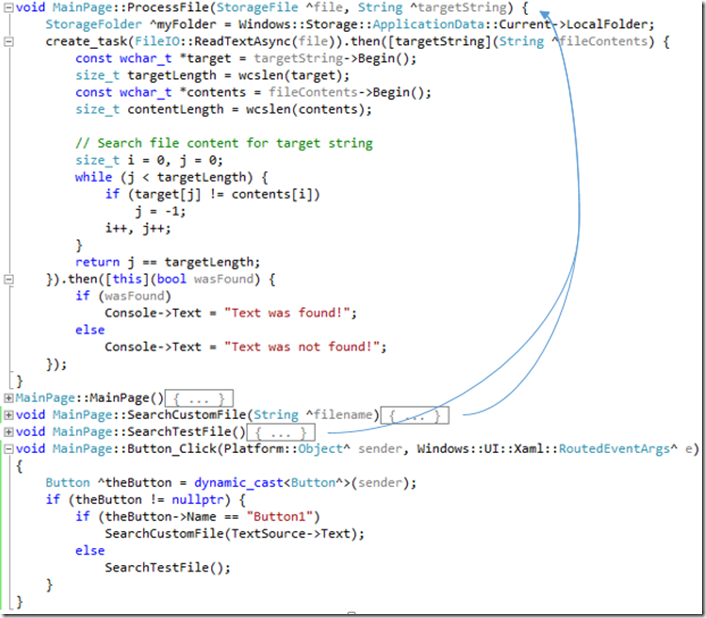
The following example in C++ demonstrates a challenge presented while debugging asynchronous code.

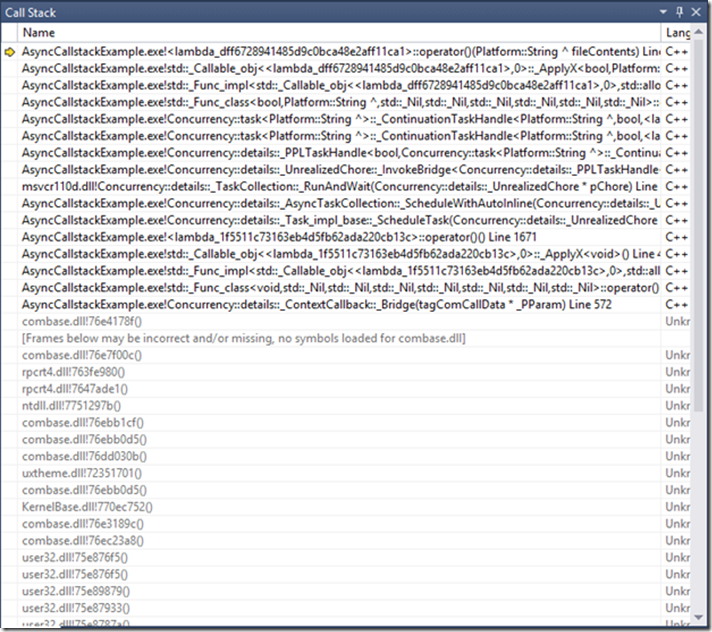
In this example, the ProcessFile function, which creates an asynchronous task with a continuation lambda, is called from two different places within the application (SearchCustomFile and SearchTestFile). The problem here is that when you run this code and the exception is thrown, you cannot quickly determine how you got there because the execution path could have been through either function. Since the task is created on a new thread, it has no information about the call stack that existed when it was scheduled and, therefore, have no information about the code sequence leading up its creation. The call stack below shows this experience in Visual Studio 2012 and Windows 8.
You can see that you hit an exception within the task continuation, but the call stack tells you nothing about which code path triggered the exception. To deal with this problem, we have added a new feature to the call stack window that provides context to the code sequence leading up to an asynchronous task. The Call Stack window for C++ will now show the frame(s) that existed on the call stack when the task was created. These additional frames are added below the task’s actual call stack and are separated from the actual call stack by an annotated frame named “[Async Call]”. As with any other frame on the call stack, double-clicking on the added frames will navigate to that frame’s source code, if available. A screenshot of the new call stack window is shown below. To minimize performance impact, the number of added frames is limited to 10 by default when in Debug mode (1 in Release mode). For situations warranting more frames, this limit may be changed by defining the PPL_TASK_SAVE_FRAME_COUNT macro in the source code with the number of frames needed.
With the new information presented in the call stack window under the “[Async Call]” annotated frame combined with the new Just My Code feature for C++, I am able to immediately discover where I am and how I got there when the First-Chance exception is caught. This will, ultimately, reduce the time it takes to find the root cause of the problem in the code.
JavaScript
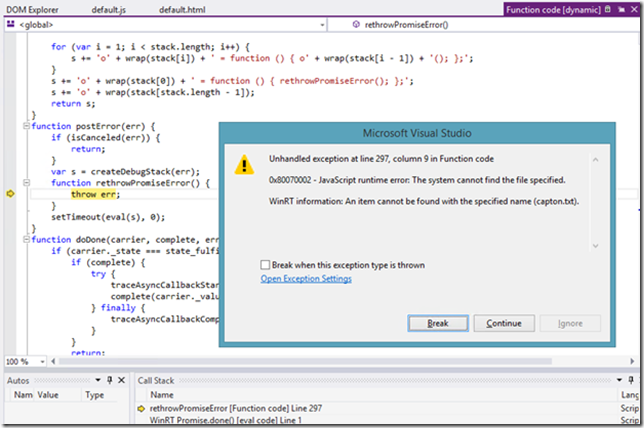
The experience when debugging JavaScript is very similar to that when debugging C++, so please read that first if you skipped to this section. In the example below, the debugger is stopped at an exception in JavaScript and there is a helpful error message. However, the current code location is not very helpful.

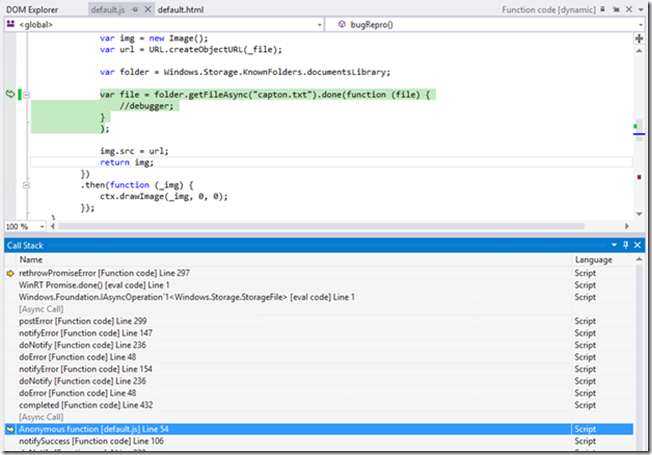
Now, look at the call stack you can see across the asynchronous calls to see how your own code led to the current state of the app. Double-clicking on the frame in default.js takes you to your own code that was the source of the issue.

C# and VB
The asynchronous call stack feature for managed code is a little different from the C++ and JavaScript experiences described above. In managed code, you have a common pattern where you have asynchronous methods awaiting other methods functions. Instead of showing the call stack when the task is created, Visual Studio will show the methods that are awaiting the current asynchronous method.
Consider the following code.
private async void Button_Click(object sender, RoutedEventArgs e)
{
    await DoWork(10);
}

private async Task DoWork(int a)
{
    await Task.Yield();
    int i = a*a;
    await GetFile(i);
}

private async Task GetFile(int a)
{
    await Task.Yield();
    StorageFolder folder = KnownFolders.DocumentsLibrary;
    StorageFile file;
    file = await folder.GetFileAsync(a.ToString() + ".txt");
}
And let’s say that you have a breakpoint set in the GetFile method. When you stop at that breakpoint, you will get the following call stack.

As with C++ and JavaScript, double-clicking on the additional frames will navigate to the source code.

We would love to hear any questions or comments you have in the comments below or on our MSDN forum.


0 comments